ASI CoC Material Flows: 2022 update
Material Flows data for 2022 from CoC certified entities
25 August 2023
CoC Material Flows data for 2022 was reported by 65 CoC Certified Entities* and is now available on the updated CoC Material Flows diagram. ASI Chain of Custody (CoC) Material flows covered 17% of total global bauxite and alumina supply, 10% of primary aluminium, 2% of semi-fabricated products, and 3% of pre- and post-consumer scrap. ASI Aluminium was in 1% of the aluminium in finished goods. At the beginning of the aluminium value chain, one-quarter of global mined bauxite production has been covered by both ASI Performance and Chain of Custody certification during 2022.
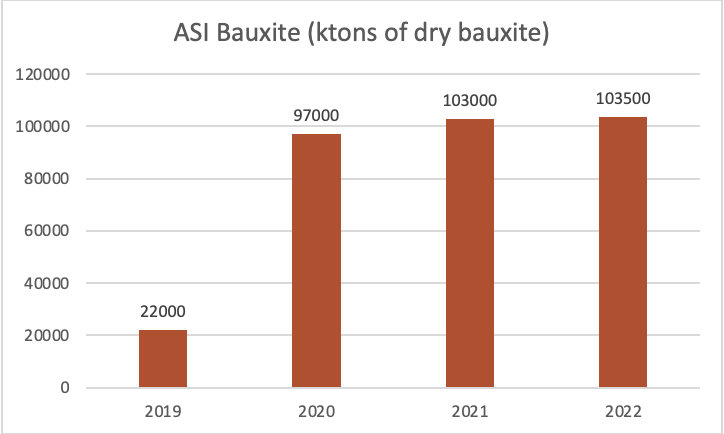
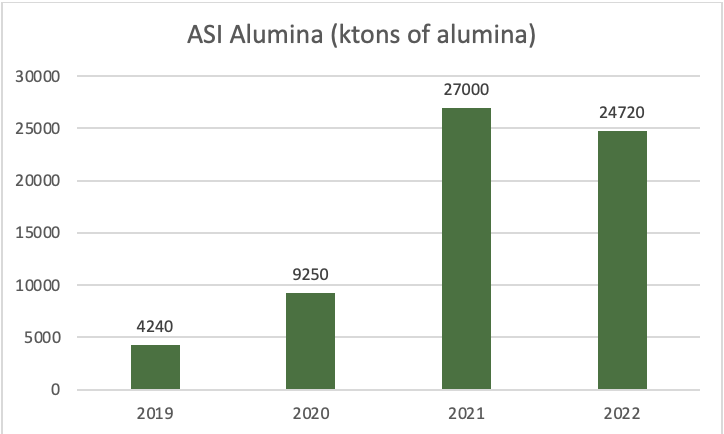
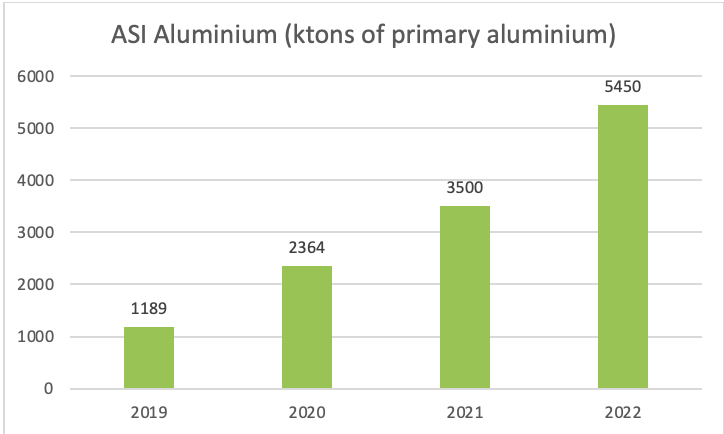
Although one new Entity producing bauxite and alumina was certified during 2022, the data shows lower volumes of ASI Bauxite and ASI Alumina moving further down the value chain. However flows of ASI Aluminium from smelters and re-melters down to final products have increased.
Bauxite production from CoC Certified mines is at nearly 25% of global bauxite production (same as last year). Only 65% of this material is then supplied to CoC Certified Alumina Refineries (a drop from 70% last year).
The production of alumina by CoC Certified Entities decreased to 25 Mt of Alumina. However, 92% of this material was shipped as ASI Alumina to CoC Certified smelters, increasing from 85% last year.
Shipments of ASI Aluminium (primary and recycled) down the value chain increased in volume and represent almost 50% of material produced (up from 33% last year).
The 2022 data shows that the early uptake of CoC Certification at the bauxite mining and alumina refining stages created a stable supply of materials reaching aluminium smelters year-on-year, despite minor fluctuations in production volumes of ASI Bauxite and ASI Alumina. Now, a greater volume of ASI Aluminium (primary and recycled) flows down the chain. This demonstrates that year-on-year, CoC Material is successively moving further through the supply chains steps, as downstream sourcing and procurement strategies continue to mature.
In the future, we anticipate increase of the CoC Material flowing through to manufacturing stages and eventually end-use products as downstream entities increase their engagement.
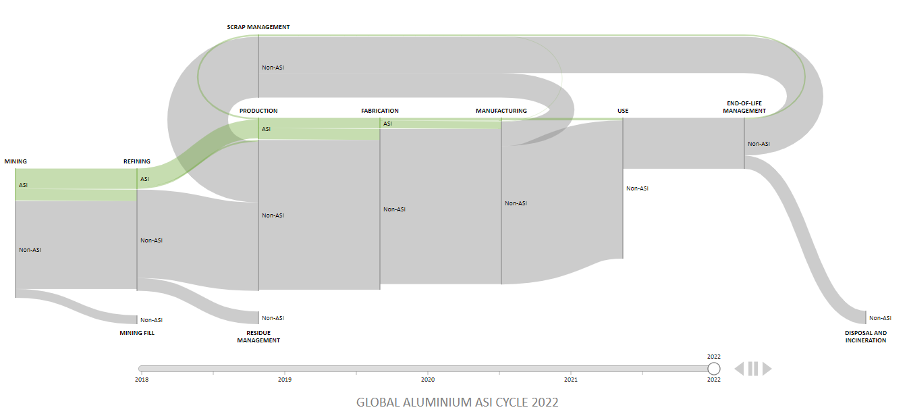
The Coc Material Flow diagram now includes four years of data, from 2019 to 2022.
Availability of CoC Material at each supply chain activity along the aluminium value chain
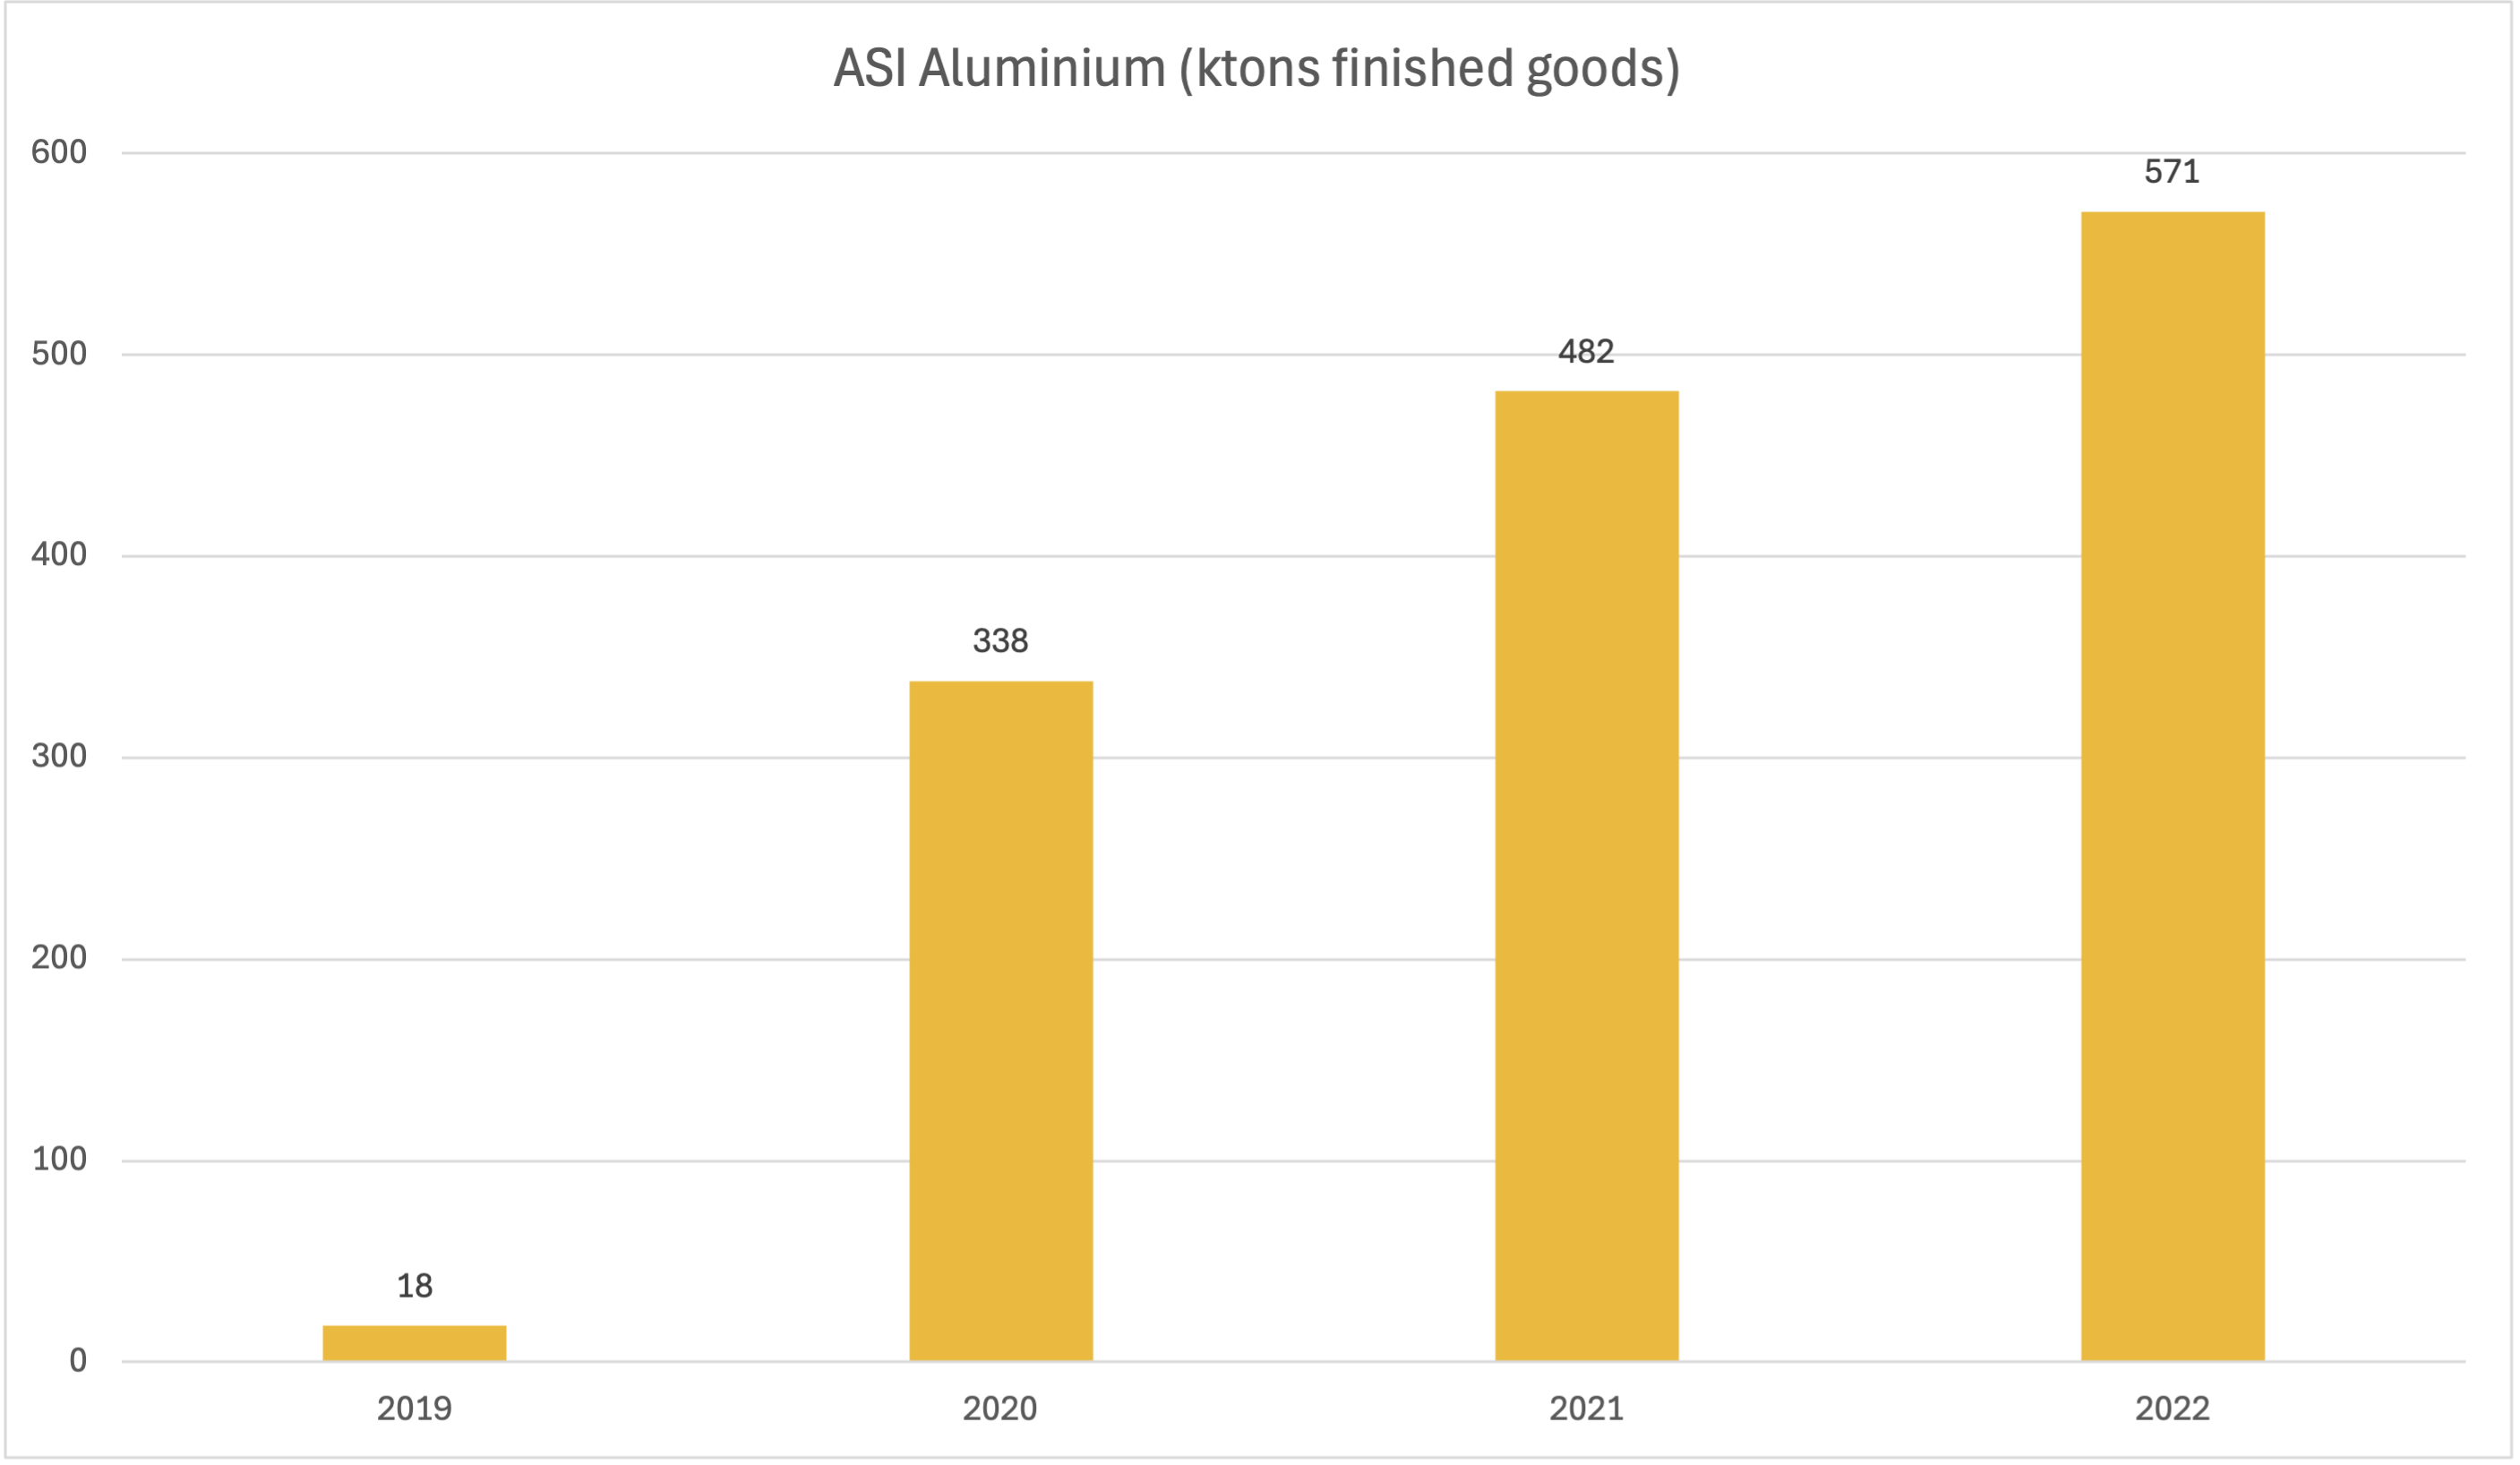
The volumes of finished goods with ASI Aluminium increased by 18%. The majority of these products are sheet (56%).
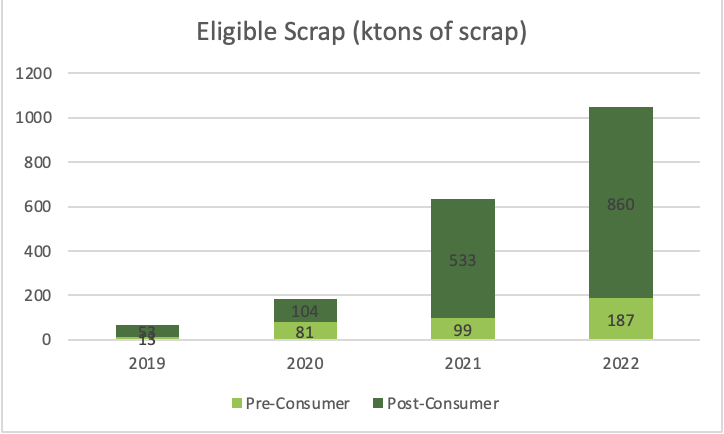
Use of Eligible Scrap continues to grow, with Post-Consumer Scrap staying predominant (82% of Eligible Scrap). Note that Pre-Consumer Scrap generated and remelted within the same Entity stays in the Entity’s closed loop, so is not required to be reported under CoC Standard and thus is not included in the visualisation.
We sincerely thank the International Aluminium Institute (IAI) for their collaboration and support and all 65 reporting ASI CoC Certified Entities for their positive engagement with this work.
For more information on ASI CoC Material Flows, contact Klaudia Michalska.
* Note that three Entities did not submit their CoC Annual Reports from the following membership classes: Production and Transformation (1); Industrial Users (2)
RELATED TOPICS:
SHARE THIS ARTICLE