D&R Insights: CO2 emissions from assets certified under the ASI Performance Standard
The latest IPCC Synthesis Report reinforces the urgency of climate action required to keep warming to 1.5°C. Reducing the aluminium sector’s emissions in line with a 1.5°C warming scenario is one of ASI’s long-term goals. What does the data show for decarbonisation of alumina refining, aluminium smelting and aluminium rolling processes from 2012 to 2022?
28 March 2023
The ASI Performance Standard V3 (2022) mandates all ASI Entities to establish pathways, targets and plans to reduce direct and indirect emissions in line with this goal, as well as requiring verification and public disclosure of emissions data.
Learn more about how ASI drives climate change mitigation and adaptation
Using the CRU Emissions Analysis Tool we looked at CO2 emissions from assets certified under the ASI Performance Standard and the evolution in the cohort’s performance at 3 points in time, five years apart: 2012, 2017 – the year when the ASI Performance Standard v2 was launched – and 2022. The CRU Emissions Analysis Tool is a web-based data portal for the benchmarking of greenhouse gas emissions in metals (including aluminium), fertilizers, and mining commodity value chains. One of the functions of the Tool allows users to search assets by their inclusion in ASI Entities with ASI Performance Standard or ASI Chain of Custody Certifications.
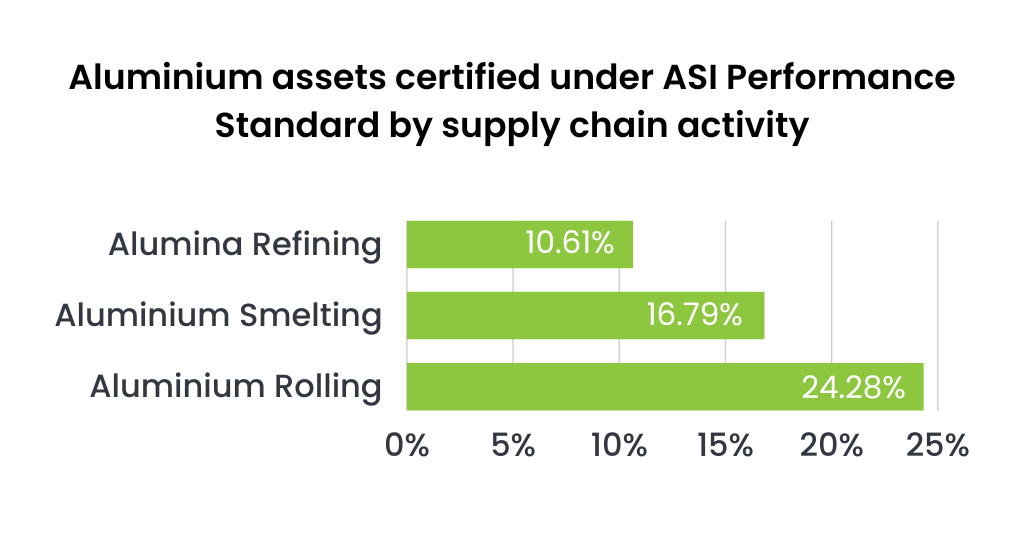
Percentage of ASI Performance Standard certified assets out of total number of aluminium assets by supply chain activity as of March 2023.
The scope of this analysis included emissions from Alumina refining, Aluminium smelting, and Aluminium rolling processes. Bauxite mining was not included as the change in emissions through the years is negligent and the emissions themselves are very low compared to other processes. The emissions cover Scope 1 and 2 at site for Alumina refining, Aluminium rolling, and Scope 1, 2, and 3 third party anode purchases for Aluminium smelting. For all years, the same list of ASI certified assets (as of March 2023) was considered in the analysis, to allow consistent tracking of changes over time, including those potentially influenced by ASI Performance Standard certification.
Alumina Refining
| Total Alumina Production from ASI certified assets (as of March 2023) | Total CO2 Emissions Scope 1 & 2 site |
|
| 2012 | 29 Mt | 20 Mt |
| 2017 | 33 Mt | 21 Mt |
| 2022 | 32 Mt | 19 Mt |
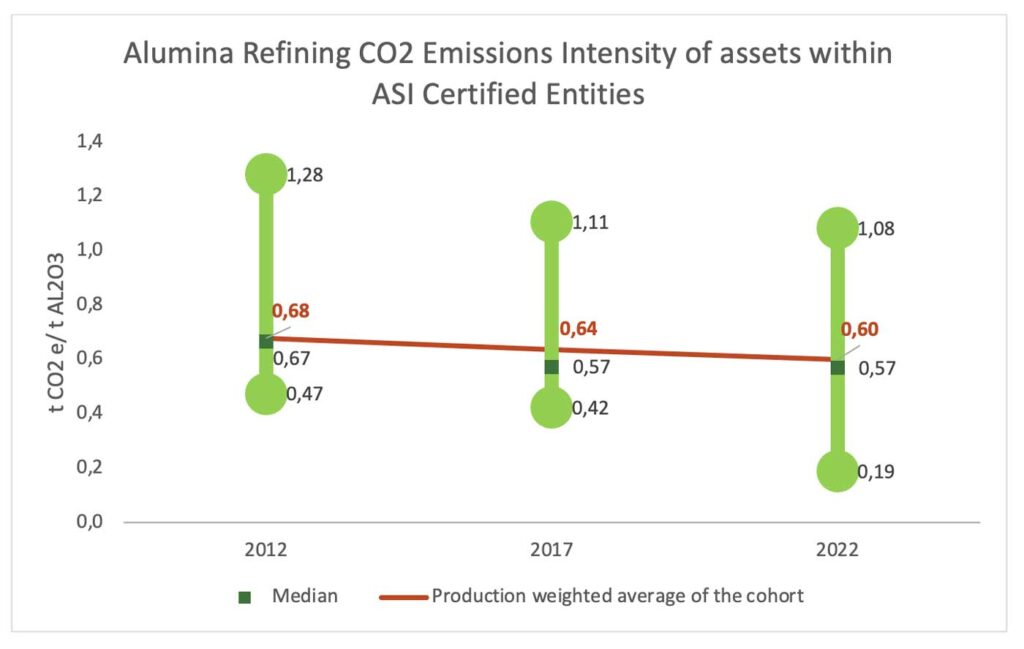
CO2 emissions intensity from Alumina refining ASI certified assets (as of March 2023) measured in 2012, 2017, and 2022.
In the above figure, the green lines represent lowest and highest intensities, with the median of all the cohort. As each asset can be in a different stage of decarbonization, in this chart each year’s lows and highs might not always represent intensity values of the same two assets. Here, the lowest emitter is different across all three years, as is the highest emitter. The production weighted average represents the total CO2 emissions from all ASI certified assets divided by their total production and represents around two thirds the global industry average scopes 1 and 2 intensity of around 1 t CO2e/t Al2O3 (note the IAI data is per tonne of aluminium at a conversion rate of 1.9 tAl2O3 per t Al.
Changes over the years:
- Increase in alumina production;
- Decrease in absolute CO2 emissions;
- Decrease in CO2 emissions intensity:
- Decrease of intensity for the lowest and highest emitters;
- Median of the whole cohort decreased between 2012 and 2017, and remained stable in 2022;
- Minor decrease of the production weighted average of the cohort.
The decrease in CO2 emissions intensity in the ASI Certified cohort results from efficiency improvements in the refining process (IAI data indicates a global energy intensity reduction for alumina refining of 15% between 2012 and 2021) and fuel switching.
The majority of emissions in refining are from the production of steam for the digestion process. While there are some alternatives where further research and development (R&D) is on-going, some refiners are already introducing electric boilers to reduce emissions now, where renewable electricity sources are available. Alternatives to gas for the calcination process require more R&D. Further details on technology options are explored in the recently released Mission Possible Partnership Aluminium Transition Strategy.
Aluminium Smelting
| Total Aluminium Production from ASI certified assets (as of March 2023) | Total CO2 Emissions Scope 1 & 2 & 3 third party anode purchases |
|
| 2012 | 14 Mt | 73 Mt |
| 2017 | 17 Mt | 84 Mt |
| 2022 | 19 Mt | 86 Mt |
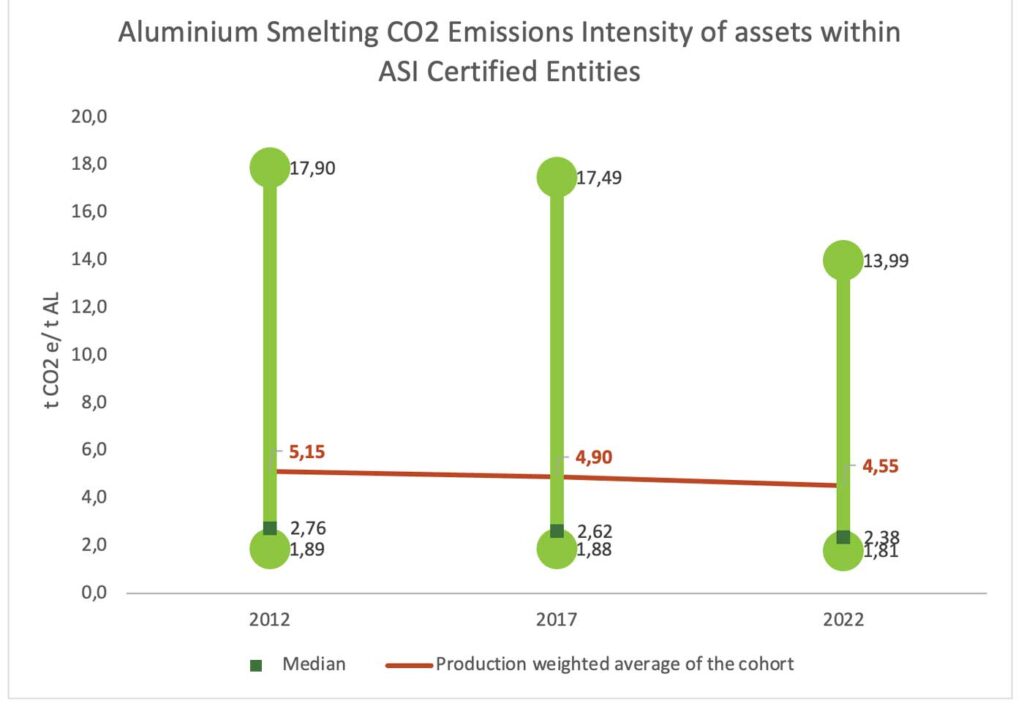
CO2 emissions intensity from Aluminium smelting ASI certified assets (as of March 2023) measured in 2012, 2017, and 2022.
In the figure above, the green lines represent lowest and highest intensities, with the median of all the cohort. In this chart, each year’s lows and highs do represent the intensity values of the same two assets. The production weighted average represents the total CO2 emissions from all ASI certified assets divided by their total production and represents less than half the global industry average scopes 1 and 2 intensity of around 13 t CO2e/t Al (note anode production and electrolysis combined, with ancillary materials and transport excluded.)
Changes over the years:
- Increase in primary aluminium production;
- Increase in absolute CO2 emissions;
- Decrease in CO2 emissions intensity:
- Substantial decrease of intensity for the highest emitter;
- Minimal decrease of intensity for the lowest emitter;
- 14% decrease in the median of the whole cohort;
- 12% decrease in the production weighted average of the cohort.
The low median indicates a concentration of ASI Certified Entities at the lower end of the scale – a function of the fact that V2 of the ASI Performance Standard limits the ability of smelters operating above 8 t CO2e/t Al (scope 1 and 2) and constructed after 2020 to achieve conformance and thus certification. Certifying smelters operating prior to 2020 are expected to reduce emissions intensity below 8 t CO2e/t Al (scope 1 and 2) by 2030 – hence the reduction seen in the upper end of the range. Note that V3 of the Performance Standard has updated these criteria (see below).
Even though emissions intensity has substantially decreased for the highest emitting entity, the overall improvement needs to further increase. To conform with the ASI Performance Standard V3 Criterion 5.2 Aluminium Smelter GHG Emissions Intensity, an Entity is required to decrease the emissions intensity to below 11 t CO2 e/ t Al or demonstrate that the intensity has been reduced by a minimum 10% over the previous three reporting periods; and establish the GHG Emissions abatement plans that ensure Mine to Metal Emissions intensity is below 13.0 t CO2e/t Al by end 2025, and below 11.0 t CO2e/t Al by end 2030. For that to happen, Scope 1 and Scope 2 emissions must be lowered. This cannot be achieved by improvements in energy efficiency alone. Change of the power mix will be the only one way to reach the target.
For the lower emitting entities using renewable energy and newest technologies it might be challenging to further lower their emissions: as shown in the figure above, the emissions intensity on the lowest end decreased by only 0.08 t CO2 per tonne of product. Novel technologies such as inert anode or the implementation of carbon capture in smelters offer opportunities to reduce these emissions further. Further R&D is required followed by a period of roll-out as smelters are retrofitted or constructed using such technologies – necessarily this will take time. Further details on technology options for smelters are also explored in the Mission Possible Partnership Aluminium Transition Strategy.
Aluminium Rolling
| Total Aluminium flat rolled Production from ASI certified assets (as of March 2023) | Total CO2 EmissionsScope 1 & 2 site | |
| 2012 | 8 Mt | 7 Mt |
| 2017 | 11 Mt | 10 Mt |
| 2022 | 13 Mt | 13 Mt |
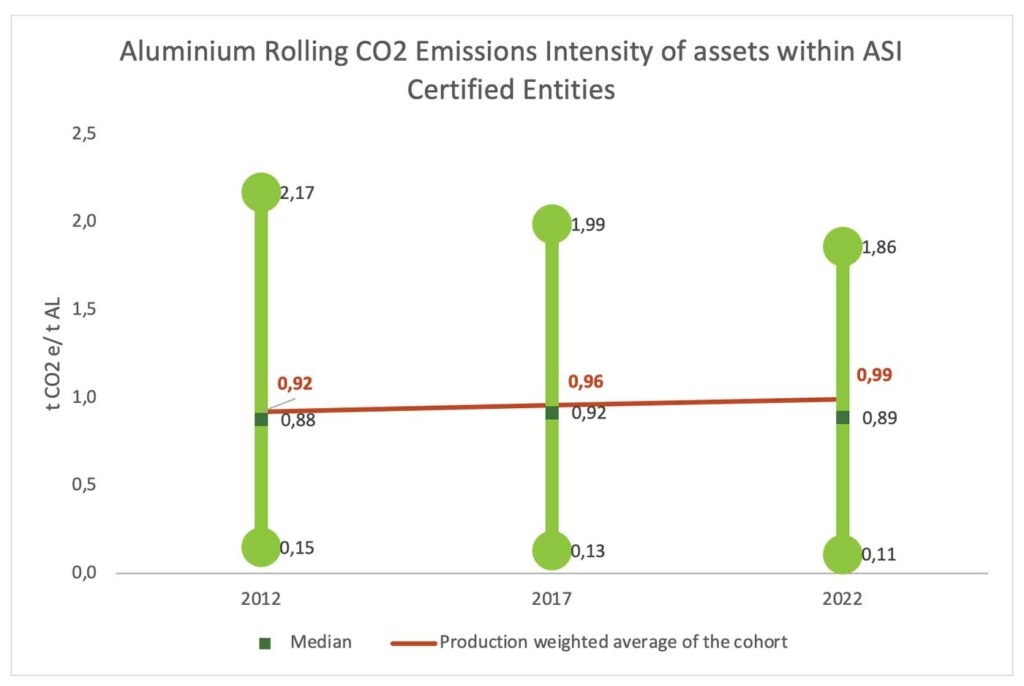
CO2 emissions intensity from Aluminium rolling ASI certified assets (as of March 2023) measured in 2012, 2017, and 2022.
In the figure above, the green lines represent lowest and highest intensities, with the median of all the cohort. In this chart, each year’s highs do not represent intensity values of the same asset. After 2012, a new asset was established and considered in 2017 and 2022 numbers, explaining an increase in intensity between 2012 and 2017. The production weighted average represents the total CO2 emissions from all ASI certified assets divided by their total production and represents 90% of the global assets average scopes 1 and 2 intensity of around 1.09 t CO2e/t Al as per CRU data.
Changes over the years:
- Increase in rolling production;
- Increase in absolute CO2 emissions;
- CO2 emissions intensity:
- Very minor decrease of intensity for the lowest and highest emitters;
- Increase in the median of the whole cohort;
- Increase of the production weighted average of the cohort.
For the ASI Certified cohort, aluminium rolling seems to be at the same levels of CO2 emissions intensity today as was 10 years ago. The reason behind this is the creation of 5 new assets after 2012. All of them are coal powered high emitting entities. This results in the slight increase in the median and average of the cohort even though the rest of assets have decreased their intensities.
Key takeaways
In 2022, aluminium smelting assets certified under ASI Performance Standard considered in this analysis under Scope 1 & 2 & 3 (third party anode purchases) emitted in total 5 million tonnes of CO2 more than in 2012. Production of material increased by 13 million tonnes. The cohort median decreased over the years rather slightly, with 2.38 tonnes of CO2 produced per 1 tonne of aluminium in 2022.
Most CO2 emissions in the aluminium industry comes from the smelting process. Therefore, the biggest changes need to happen here if we want to be on the right decarbonisation pathway to a 1.5°C future. ASI Performance Standard V3 puts a threshold on smelters designed to exclude new coal-fired production from certification but to allow existing coal-intensive producers to certify by reducing their emissions along 1.5°C aligned pathways.
For smelting globally, the majority of emissions come from fossil-fuel based electricity and so the biggest reductions to smelting emissions will come from fuel switch source to renewable electricity, where available – but not needing a technology change or R&D for major reductions. However, similarly to calcining in refining, carbon anodes consumed in smelting are a major source of emissions and to remove those emissions, further R&D is required, which a relatively small number of companies (ASI members primarily) is working on.
Entities active in other supply chain activities also cannot sit still. The 1.5°C pathway applies to everyone in the chain. To support ASI Certified Entities in emissions reduction, ASI collaborates with several partners to deliver 1.5°C pathway for the aluminium sector including International Aluminium Institute (IAI), Mission Possible Partnership, Center for Climate Aligned Finance and CRU Group.
While exploring new technologies to increase energy efficiency in aluminium production and lowering emissions, we cannot forget that what really matters for mitigating climate change are total emissions.
The remaining global carbon budget to stay below 1.5°C is 380 BN tonnes of CO2, with the aluminium sector’s share of this volume at around 15 billion tonnes (https://missionpossiblepartnership.org/action-sectors/aluminium/). At a current sector wide annual emissions rate of 1.1bn t CO2e, the aluminium industry will hit this number in less than ten years, if there is no action to move from business as usual even assuming no growth in production.
Join us in London in May 2023 to discuss aluminium decarbonisation and more
ASI has partnered with IAI and CRU to co-host World Aluminium Conference on the 16-18 May in London. The agenda integrates sustainability and market insights focused on the aluminium value chain. Topics around climate change will focus on decarbonisation strategies and carbon accounting methodologies.
ASI Members can register for the 3-day event at a reduced cost. Register now!
SHARE THIS ARTICLE