D&R Insights: CO2 emissions: Certified vs. non-certified assets under the ASI Performance Standard
Reducing the aluminium sector’s emissions in line with a 1.5°C warming scenario is one of ASI’s long-term goals. In February 2024, ASI published an ASI Entity-Level GHG Pathways Method for ASI Entities to support them in determining 1.5°C aligned GHG Emissions Reduction Pathways.
29 April 2024
Key takeaways
Bauxite Mining: ASI certified assets demonstrate lower CO2 emissions intensity than non-certified assets, contributing 28% of global Bauxite CO2 emissions and producing 36% of global bauxite volumes.
Alumina Refining: CO2 emissions intensity from ASI certified assets stand below the global average with a production weighted average of 0.61 t CO2/ t Alumina. Assets contribute to 12% of global Alumina CO2 emissions with 24% of global alumina production volumes.
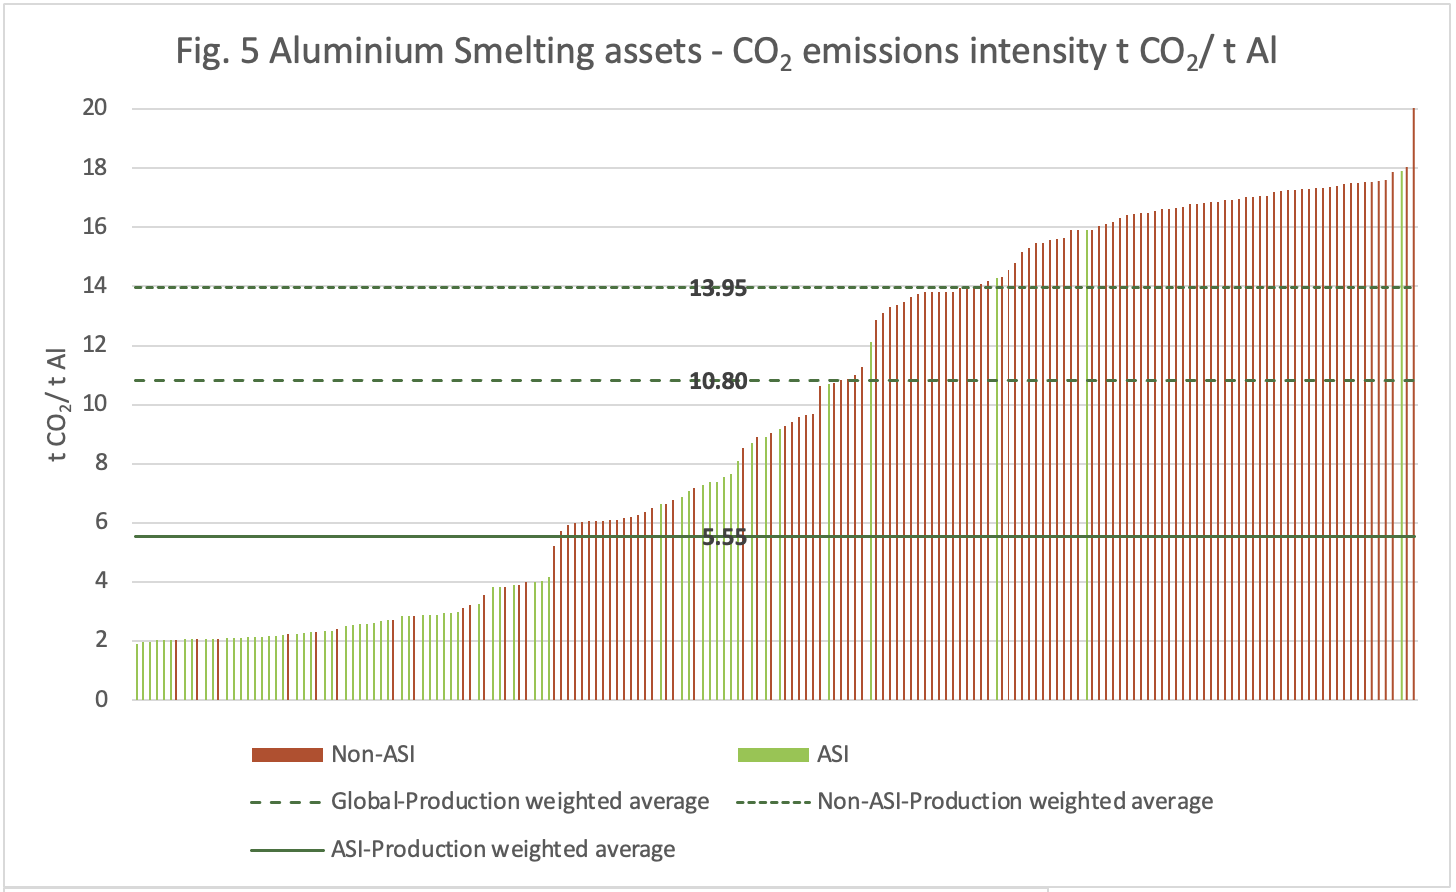
Aluminium Smelting: High concentration of ASI certified assets with CO2 emissions intensity below 5 t CO2/ t Aluminium limited by the criteria from the V2 of the Performance Standard. Updates to V3 of the Performance Standard allows for inclusion of higher emitting assets to drive and accelerate emission reductions in aluminium sector. Assets contribute to 19% of global Primary Aluminium CO2 emissions with 37% of global primary aluminium production volumes.
Aluminium Rolling: ASI certified assets produced half of global rolled Aluminium volumes, contributing to 45% of global rolled Aluminium CO2 emissions. With lower emissions intensity (by an order of magnitude) and a narrower range of performance, driven partly by technology, partly by the grid mix of purchased electricity, rolling processes are unlikely to show as great a difference between assets within ASI certified Entities and non-certified assets as upstream processes.
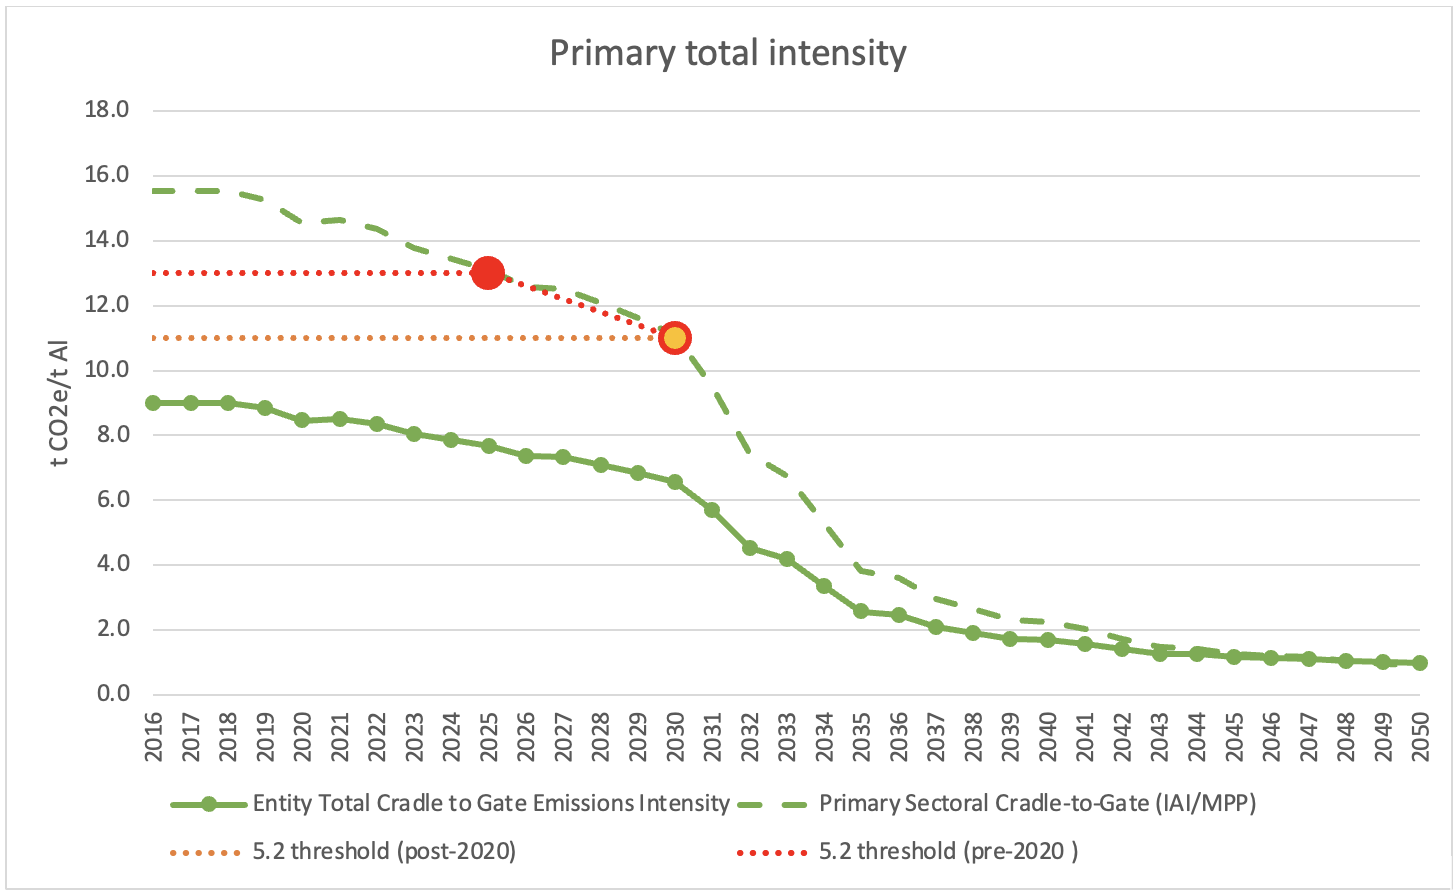
Taking the average (2022) ASI Entity performance form, and using this as input to the ASI GHG Pathways Method, we can see that even low emitting cohorts will need to reduce emissions significantly to be 1.5oC degree aligned. A low baseline is a privileged starting point, but it does not mean complacency:

CO2 emissions intensity from Aluminium Rolling assets covering Scope 1 and 2 at site.
Learn more about the ASI Entity GHG Pathways Method and Calculation Tool
Using the CRU Emissions Analysis Tool we looked at CO2 emissions from assets certified and non-certified under the ASI Performance Standard in 2022. The CRU Emissions Analysis Tool is a web-based data portal for the benchmarking of greenhouse gas emissions in metals (including aluminium), fertilizers, and mining commodity value chains. One of the functions of the Tool allows users to search assets by their inclusion in ASI Entities with ASI Performance Standard or ASI Chain of Custody Standard Certifications.

Percentage of ASI Performance Standard certified assets out of total number of aluminium assets by supply chain activity as of March 2024.
The scope of this analysis included CO2 emissions in 2022 from Bauxite Mining, Alumina Refining, Aluminium Smelting, and Aluminium Rolling processes. The emissions cover Scope 1 and 2 for Bauxite Mining, Scope 1 and 2 at site and Ocean Fright Scope 3 for Alumina refining, Scope 1 and 2 at site Aluminium rolling, and Scope 1, 2, and 3 third party anode purchases for Aluminium smelting. The used list of assets certified under the ASI Performance Standard is up to date as of March 2024.
Data for each asset group is represented on two types of figures. Figures 1, 3, 5, and 7 represent distribution of assets and their CO2 emissions intensity (t CO2/ t Material) with production weighted averages for ASI certified, Non-ASI certified and global cohorts. The production weighted average represents the total CO2 emissions from one cohort divided by their total material production. While figures 2, 4, 6, and 8 compare certified and non-certified assets and their CO2 emissions and production volumes.
Bauxite Mining
Bauxite Mining key points:
- The highest CO2 emissions intensity for an ASI certified asset is at 0.035 t CO2/ dmt (dry metric tons) Bauxite.
- CO2 emissions production weighted average from ASI certified assets is over three times lower than from non-certified assets.
- In 2022, ASI certified assets produced 36% of global Bauxite volumes, contributing to 28% of global CO2 emissions from mining.
Mining assets certified under PS Standard typically show lower CO2 emissions intensities as they are major producers, benefiting from economies of scale that maximizes energy efficiency. Smaller mines producing less bauxite, even though they operate in a similar way, tend to have higher energy consumption per unit of output.

CO2 emissions intensity from Bauxite Mining assets covering Scope 1 and 2
Alumina Refining
Alumina Refining key points:
- ASI certified assets are concentrated towards the lower end of emissions intensity per production volumes, with no significant outliers.
- The highest CO2 emissions intensity for an ASI certified asset stands at 1.12 t CO2/ t Alumina.
- CO2 emissions production weighted average from ASI certified assets (0.61 t CO2/ t Alumina) is over two times lower than the average from non-certified assets (1.41 t CO2/ t Alumina).
- All ASI certified assets fall below the global average of 1.23 t CO2/ t Alumina
- ASI certified assets produced 24% of global Alumina volumes, contributing to 12% of global CO2 emissions from refining.

CO2 emissions intensity from Alumina Refining assets covering Scope 1 and 2 at site and Ocean Fright Scope 3.
The majority of emissions in refining are from the production of steam for the digestion process. While there are some alternatives where further research and development (R&D) is on-going, some refiners are already introducing electric boilers to reduce emissions now, where renewable electricity sources are available. Alternatives to gas for the calcination process require more R&D.
Differences in emissions intensity between ASI certified and non-certified assets comes from differences in bauxite quality and digestion temperature. ASI certified refineries primarily use low temperature digestion, due to access to gibbsitic bauxite with lower silica content and higher alumina availability. Non-certified assets typically use high temperature digestion, while relying on the same technology and quality of bauxite across the whole cohort.
Aluminium Smelting
Aluminium Smelting key points:
- ASI certified assets are concentrated in three groups:
- Assets using renewable energy – CO2 emissions intensity below 5 t CO2/ t Al
- Assets powered by natural gas – CO2 emissions intensity 6 – 8 t CO2/ t Al
- Assets powered by thermal coal – CO2 emissions intensity above 8 t CO2/ t Al with four assets above 11 t CO2/ t Al.
- The highest CO2 emissions intensity for an ASI certified asset is at 17.9 t CO2/ t Aluminium.
- CO2 emissions production weighted average from ASI certified assets is two and a half times lower than that from non-certified assets.
- ASI certified assets produced 37% of global primary Aluminium volumes, contributing to 19% of global CO2 emissions from smelting.

CO2 emissions intensity from Aluminium Smelting assets covering Scope 1, 2, and 3 third party anode purchases.
ASI Performance Standard limited the ability of smelters operating above 8 t CO2e/t Al (scope 1 and 2) and constructed after 2020 to achieve conformance and thus certification. Certifying smelters operating prior to 2020 were expected to reduce emissions intensity below 8 t CO2e/t Al (scope 1 and 2) by 2030 – hence the reduction seen in the upper end of the range.
In the V3 of the Performance Standard these criteria have been updated. To conform with the ASI Performance Standard V3 Criterion 5.2 Aluminium Smelter GHG Emissions Intensity, an Entity is required to decrease the emissions intensity to below 11 t CO2 e/ t Al or demonstrate that the intensity has been reduced by a minimum 10% over the previous three reporting periods; and establish the GHG Emissions abatement plans that ensure Mine to Metal Emissions intensity is below 13.0 t CO2e/t Al by end 2025, and below 11.0 t CO2e/t Al by end 2030. For that to happen, Scope 1 and Scope 2 emissions must be lowered but a shift in power mix is the predominant way for high emitting smelters to reach this target. Therefore, higher emitting Entities are encouraged to pursue Performance Standard Certification as it signifies their commitment to decarbonization. This in turn drives tangible progress in reducing emissions within the aluminium sector.
In February 2024, ASI published the ASI Entity-Level GHG Pathways Method to enable ASI Entities to articulate quantifiable aluminium-related 1.5oC aligned GHG Emissions Reduction Pathways, against which performance can be regularly measured and disclosed. The method is a move that turns ambition into (proof of) action towards driving the aluminium sector towards a 1.5 degree aligned future.
Aluminium Rolling
Aluminium Rolling key points:
- ASI certified assets are distributed across the entire global range.
- The highest CO2 emissions intensity for an ASI certified asset is at 2.67 t CO2/ t Aluminium.
- CO2 emissions production weighted average from Asi certified assets is two and a half times lower than from non-certified assets.
- ASI certified assets produced half of global rolled Aluminium volumes, contributing to 45% of global CO2 emissions from rolling.

CO2 emissions intensity from Aluminium Rolling assets covering Scope 1 and 2 at site.
While all rolling mills globally rely on similar energy inputs, such as grid electricity, small differences between CO2 emission intensities can be caused from factors such as location – particularly in China where coal power predominates – or type of rolling process, whether cold or hot.
Join us in London in May 2024 to discuss aluminium decarbonisation and more
ASI has partnered with IAI and CRU to co-host World Aluminium Conference on the 14-16 May in London. The agenda integrates sustainability and market insights focused on the aluminium value chain. Topics around climate change will focus on carbon accounting methodologies and available tools.
SHARE THIS ARTICLE


