D&R Insights: Land requirements for energy production for aluminium smelters certified under the ASI Performance Standard
Decarbonising energy production – a requirement of Performance Standard Principle 5 – has land use implications. Land-use changes for development can have significant environmental and social impacts.
28 November 2023
In this edition of D&R Insights, we delve into the complex interplay between land use, climate change, and energy production. The land-climate-energy nexus is a sometimes-ignored aspect of sustainable development, particularly in the context of aluminium smelting. The aluminium smelting process is energy intensive and draws from various energy sources, each with its unique land footprint (and associated socio-environmental impacts). Understanding these dynamics is key to navigating the challenges and opportunities in the pursuit of a decarbonised future.
Land requirements to produce 1 GWh of power depend on the fuel used to generate electricity. Hydroelectric power has the highest land requirements as river dams and reservoirs need to be constructed. Renewable sources such as wind and solar also have high land requirements, although they are lower than hydropower. Coal power plants require additional space for the coal storage and the overall land needed can be influenced the type of technology used. Nuclear power plants tend to have lower land needs, primarily for building a reactor, cooling systems, and waste storage. Land requirements for natural gas can vary significantly based on the type of plant (e.g. combined cycle, gas turbine).
Land use changes caused by infrastructure development can disrupt natural ecosystems, leading to a loss of wildlife habitat and biodiversity, impacts on the water cycle, as well as release of stored carbon dioxide into the atmosphere, contributing to climate change. Such disruptions can compromise ecosystem services crucial at both local and global scales, impacting communities reliant on these services. This can limit their access to essential resources, potentially affecting food security and overall well-being. In areas with local communities and Indigenous Peoples, poorly considered developments can have adverse effects on cultural practices, traditions, and their connection to ancestral lands. While this article focuses on quantifying the land use requirements associated with power generation for aluminium smelting, these broader impacts must also be borne in mind.
Power consumption by fuel source
Figure 1 illustrates the distribution of the global power consumption for primary aluminium smelting by fuel source in 2022, comparing data from the International Aluminium Institute (IAI) for worldwide figures and the CRU Emissions Analysis Tool for the ASI cohort of PS Certified aluminium smelters.
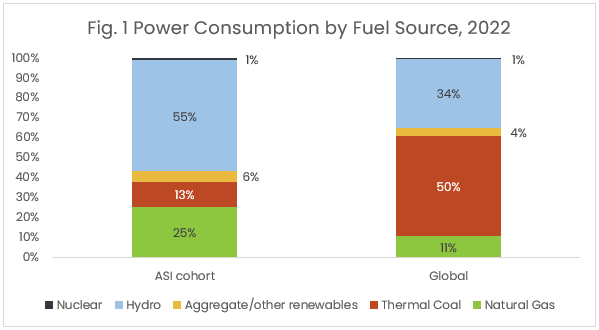
Globally, the IAI data shows that thermal coal dominated smelting power consumption at 50%, with renewables (hydro, solar, wind, geothermal) accounting for 38%. In contrast, the ASI cohort has a higher reliance on renewables of 61%, with only 13% drawing from coal power generation.
The lower share of thermal coal within ASI cohort is linked to the ASI PS criteria around GHG emissions intensity. In 2017, the initial ASI PS V2 (criterion 5.2) mandated Entities engaged in smelting to demonstrate that the Scope 1 and Scope 2 GHG emissions from the production of Aluminium is at a level below 8 tonnes CO2-eq per metric tonne Aluminium (achievable by 2030 for smelters in production up to and including 2020). In 2022, the ASI PS V3 (criterion 5.2) set the Mine to Metal Emissions intensity threshold at 11 t CO2e/t Al (incorporating all steps of primary production). Both had the effect of potentially hindering coal-powered smelters from obtaining ASI certification in the future until they meet the required emission thresholds.
Over the last decade (measured at 2012, 2017 and 2022), power generation from all fuel sources increased, except for nuclear. The global and ASI cohort percentages of natural gas and other renewables have risen, while the relative proportion of hydroelectric power consumption has decreased.
Calculating land requirements for energy consumption
To determine land requirements for energy production we looked at power consumption, land use intensity, and capacity factors for various fuel sources. Using the CRU Emissions Analysis Tool we examined:
- Scope 1 & 2 power consumption data from aluminium smelters certified under the ASI Performance Standard
- The evolution in the cohort’s performance at 3 points in time, five years apart: 2012, 2017 – the year when the ASI Performance Standard v2 was launched – and 2022.
For all years, the same list of ASI certified smelters (as of October 2023) was considered in the analysis, to allow consistent tracking of changes over time, including those potentially influenced by ASI Performance Standard certification. Smelters which were closed or idle as of 2022 were excluded from the analysis. For more information on data sources and method, see the Notes section below.
Estimated energy-related land requirements for the smelting of aluminium [m2 /t Al]
Based on source data, the global and regional energy-related land requirements for aluminium production within ASI’s cohort are shown in Figures 2 and 3 and point to regional variations in land use requirements.
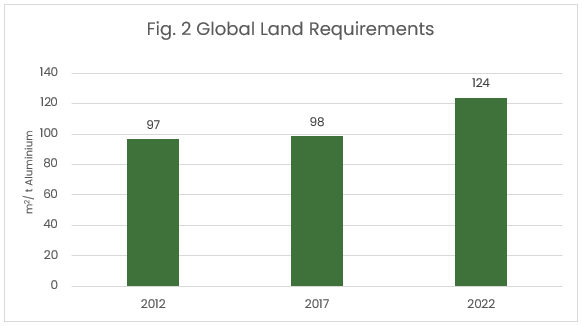
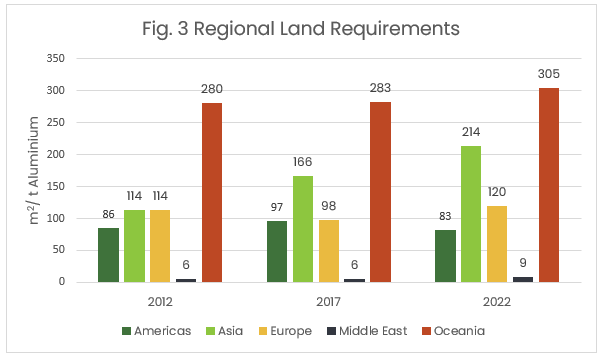
Globally and regionally, there has predominantly been a growth in energy-related land use requirements for aluminium smelting. Regional variations relate to factors including age and associated energy efficiency of smelters, power mix, construction of new renewable sources (eg hydropower). Overall over the last decade, energy-related land requirements for ASI PS Certified smelters have increased by an estimated 28% from 97 m2 / tonne of Aluminium produced in 2012, to 124 m2 / tonne Aluminium in 2022.
Estimated total energy-related land requirements
The total surface area (expressed in km2) allocated to energy-related land requirements for aluminium smelting have increased over the last decade, due to growth in aluminium production and corresponding rise in energy use (see figure 4). Within that, land requirements for power generation from all types of fuel sources except nuclear power have increased over the decade. Hydroelectric power has the biggest land requirement, nearly doubling over the decade (from an estimated 1511 km2 in 2012 to 2812 km2 in 2022).
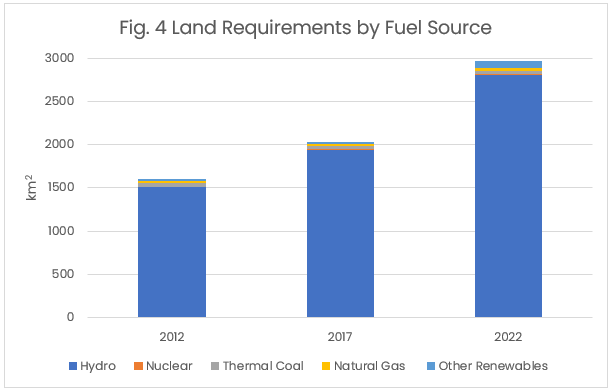
Figure 5 shows the hydropower related land requirements in more detail. Regionally, the use of hydroelectric power increased by an estimated 459% in Asia over the decade (from 270 km2 in 2012 to 1510 km2 in 2022).
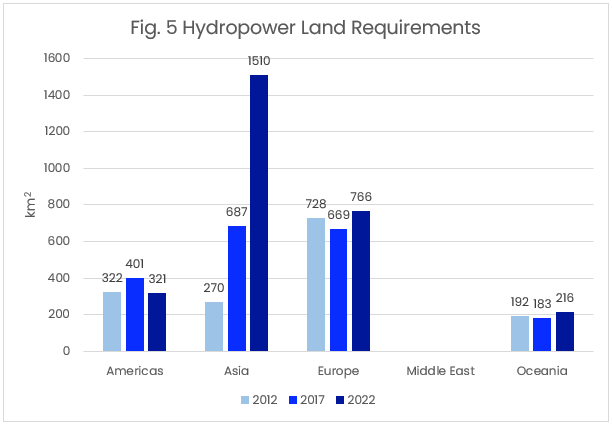
The columns in the figure above representing land requirements for Asia provide an overview of data for the entire region. Drawing from a more detailed breakdown for this region with a focus on China and Asia (excl. China), hydropower-related land requirements in China surged by an estimated 520% (from 170 km2 in 2012 to 1054 km2 in 2022), while in Asia (excl. China) rose more than fourfold (from an estimated 108 km2 in 2012 to 482 km2 in 2022). The tremendous growth in China is attributed to a sixfold increase in the use of the hydroelectric power.
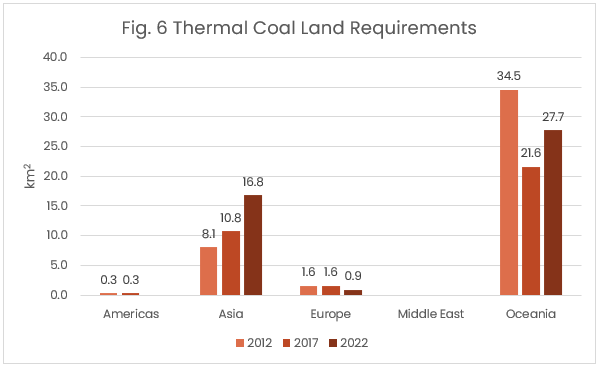
Meanwhile, thermal coal related land requirements saw an estimated overall increase of 73% (from 45 km2 in 2012 to 78 km2 in 2022). Regionally, Europe and Oceania recorded a decrease, while Asia saw a doubling (from an estimated 8 km2 in 2012 to 16 km2 in 2022) (Figure 6).
Reflections
To provide perspective on the scale of land utilization, combining all energy-related land requirements necessary to power the currently ASI PS Certified aluminium smelters in 2022 currently requires a little more land (2971 km2) than the size of Luxembourg (which occupies 2590 km2).

The land required in 2022 to power ASI PS Certified aluminium smelters is nearly equal to the size of Luxembourg, highlighting the scale of land use for energy production.
The transition to cleaner energy sources and the increasing demand for aluminium have significant implications for land use. This shift, while necessary for a decarbonised future, poses land-related challenges for nature, ecosystem services and affected communities, in particular Indigenous and local land-connected peoples. It underscores the need for balanced and thoughtful approaches in managing land resources, ensuring that the pursuit of clean energy – while essential to a decarbonised future – does not come at the expense of ecological integrity or social equity. The insights gathered here highlight the importance of comprehensive strategies that consider the full spectrum of impacts associated with energy transitions.
Notes:
- The CRU Emissions Analysis Tool is a web-based data portal for the benchmarking of greenhouse gas emissions in metals (including aluminium), fertilizers, and mining commodity value chains. One of the functions of the Tool allows users to search assets by their inclusion in ASI Entities with ASI Performance Standard or ASI Chain of Custody Certifications.
- Scope 1 emissions are direct GHG emissions from sources controlled or owned by an organization. Scope 2 emissions are indirect GHG emissions associated with the purchase of electricity, steam, heat or cooling.
- Land use intensity (m2/MWh) relating to different primary energy sources used for electricity in each global region, were obtained from Energy and Land use – Global Outlook, UNCCD, IRENA. They are an indicative metric of an occupied area and include land use for spacing of a power generation facility (e.g. dispersion over a large area such as for wind and solar farms) and from upstream life cycles (e.g. mining).
- Capacity factors for non-fossil fuel and fossil fuel sources were sourced from United States Energy Information Administration (USEIA). For natural gas, the capacity factors of combined cycle power plants were used.
- Regarding renewable energy (wind, solar, geothermal, biomass) other than hydro, which has its own category, land use intensity were chosen differently for each region based on assumptions of predominant renewable source used. Specifically, wind was assumed for Asia, Europe, and Oceania, while solar was assumed for the Middle East. Assets in North America and South America did not rely on these renewable power sources.
SHARE THIS ARTICLE