GHG Method Calculation Tool – Your questions answered
Dive in to the nuts and bolts of the Microsoft Excel-based calculation tool supporting the ASI Entity-Level GHG Pathways Method.
10 April 2024
In this article we will look into the nuts and bolts of the Microsoft Excel-based calculation tool supporting the ASI Entity-Level GHG Pathways Method, address some of the questions asked by ASI Entities and Auditors since its release and explore anticipated refinements and improvements to the workbook. All up-t0-date versions of the tools are available on the Document Centre under ‘Tools’.
Since its publication, ASI Members and other stakeholders have been testing the tool using real-world data specific to their Entities and providing feedback to the ASI Secretariat, as well as tuning into a 45 minutes on…webinar (resulting in a record attendance of over 200 listeners across two broadcasts) and taking the educationAL GHG Pathways learning course.
Responding to the feedback received, we have since released a version of the tool compatible with older versions of Microsoft Excel, with the same method and data but addressing the issue of dynamic array formulae failing to spill into Entity slope results fields, by using fixed LOOKUP functions. Either version of the tool can be used by Entities, but those using legacy versions of Excel should find the updated release works better.
Why is the calculation tool based on Microsoft Excel?
While an alternative solution might be more elegant and powerful, ASI’s aim was to make the method and tool as simple and accessible as possible. We know that certifying Members, while exploring a range of novel data manipulation and visualisation technologies, default to the use of Excel – it is widely used and its functionality well understood. In addition, its relatively static, cell-referencing formulae are easily interrogated by users, making it a transparent way of sharing the method functions and underlying datasets. Unfortunately, this also makes fields easy to change by users (intentionally or by mistake), hence the tool worksheets are shared as locked (although we also provide the password in the workbook for users to unlock if they desire).
In 2024, ASI is exploring the potential for a web-based tool, allowing centralised control of underlying datasets, but delivering a more powerful and tailored user experience and slope outputs (including visualisations).
How does the tool work?
User-entered base year emissions intensity data is matched with that year’s value in a set of tables containing archetypal slopes, corresponding to the appropriate process or procurement category (these archetypal slopes can be found in hidden worksheets in the tool – see below). The whole (2016-2050) slope containing the matched intensity value in the chosen base year is then pulled unchanged from the data table as the Entity-level GHG Pathway.

The reason we use fixed archetypal slopes is to avoid functions that dynamically generate slopes, which is difficult to achieve with (non-macro) Microsoft Excel functions, requires increased processing power, and because having data tables allows Entities to interrogate the sectoral dataset more easily.
Why is the base year intensity value in the generated slope slightly different from the original base year data input?
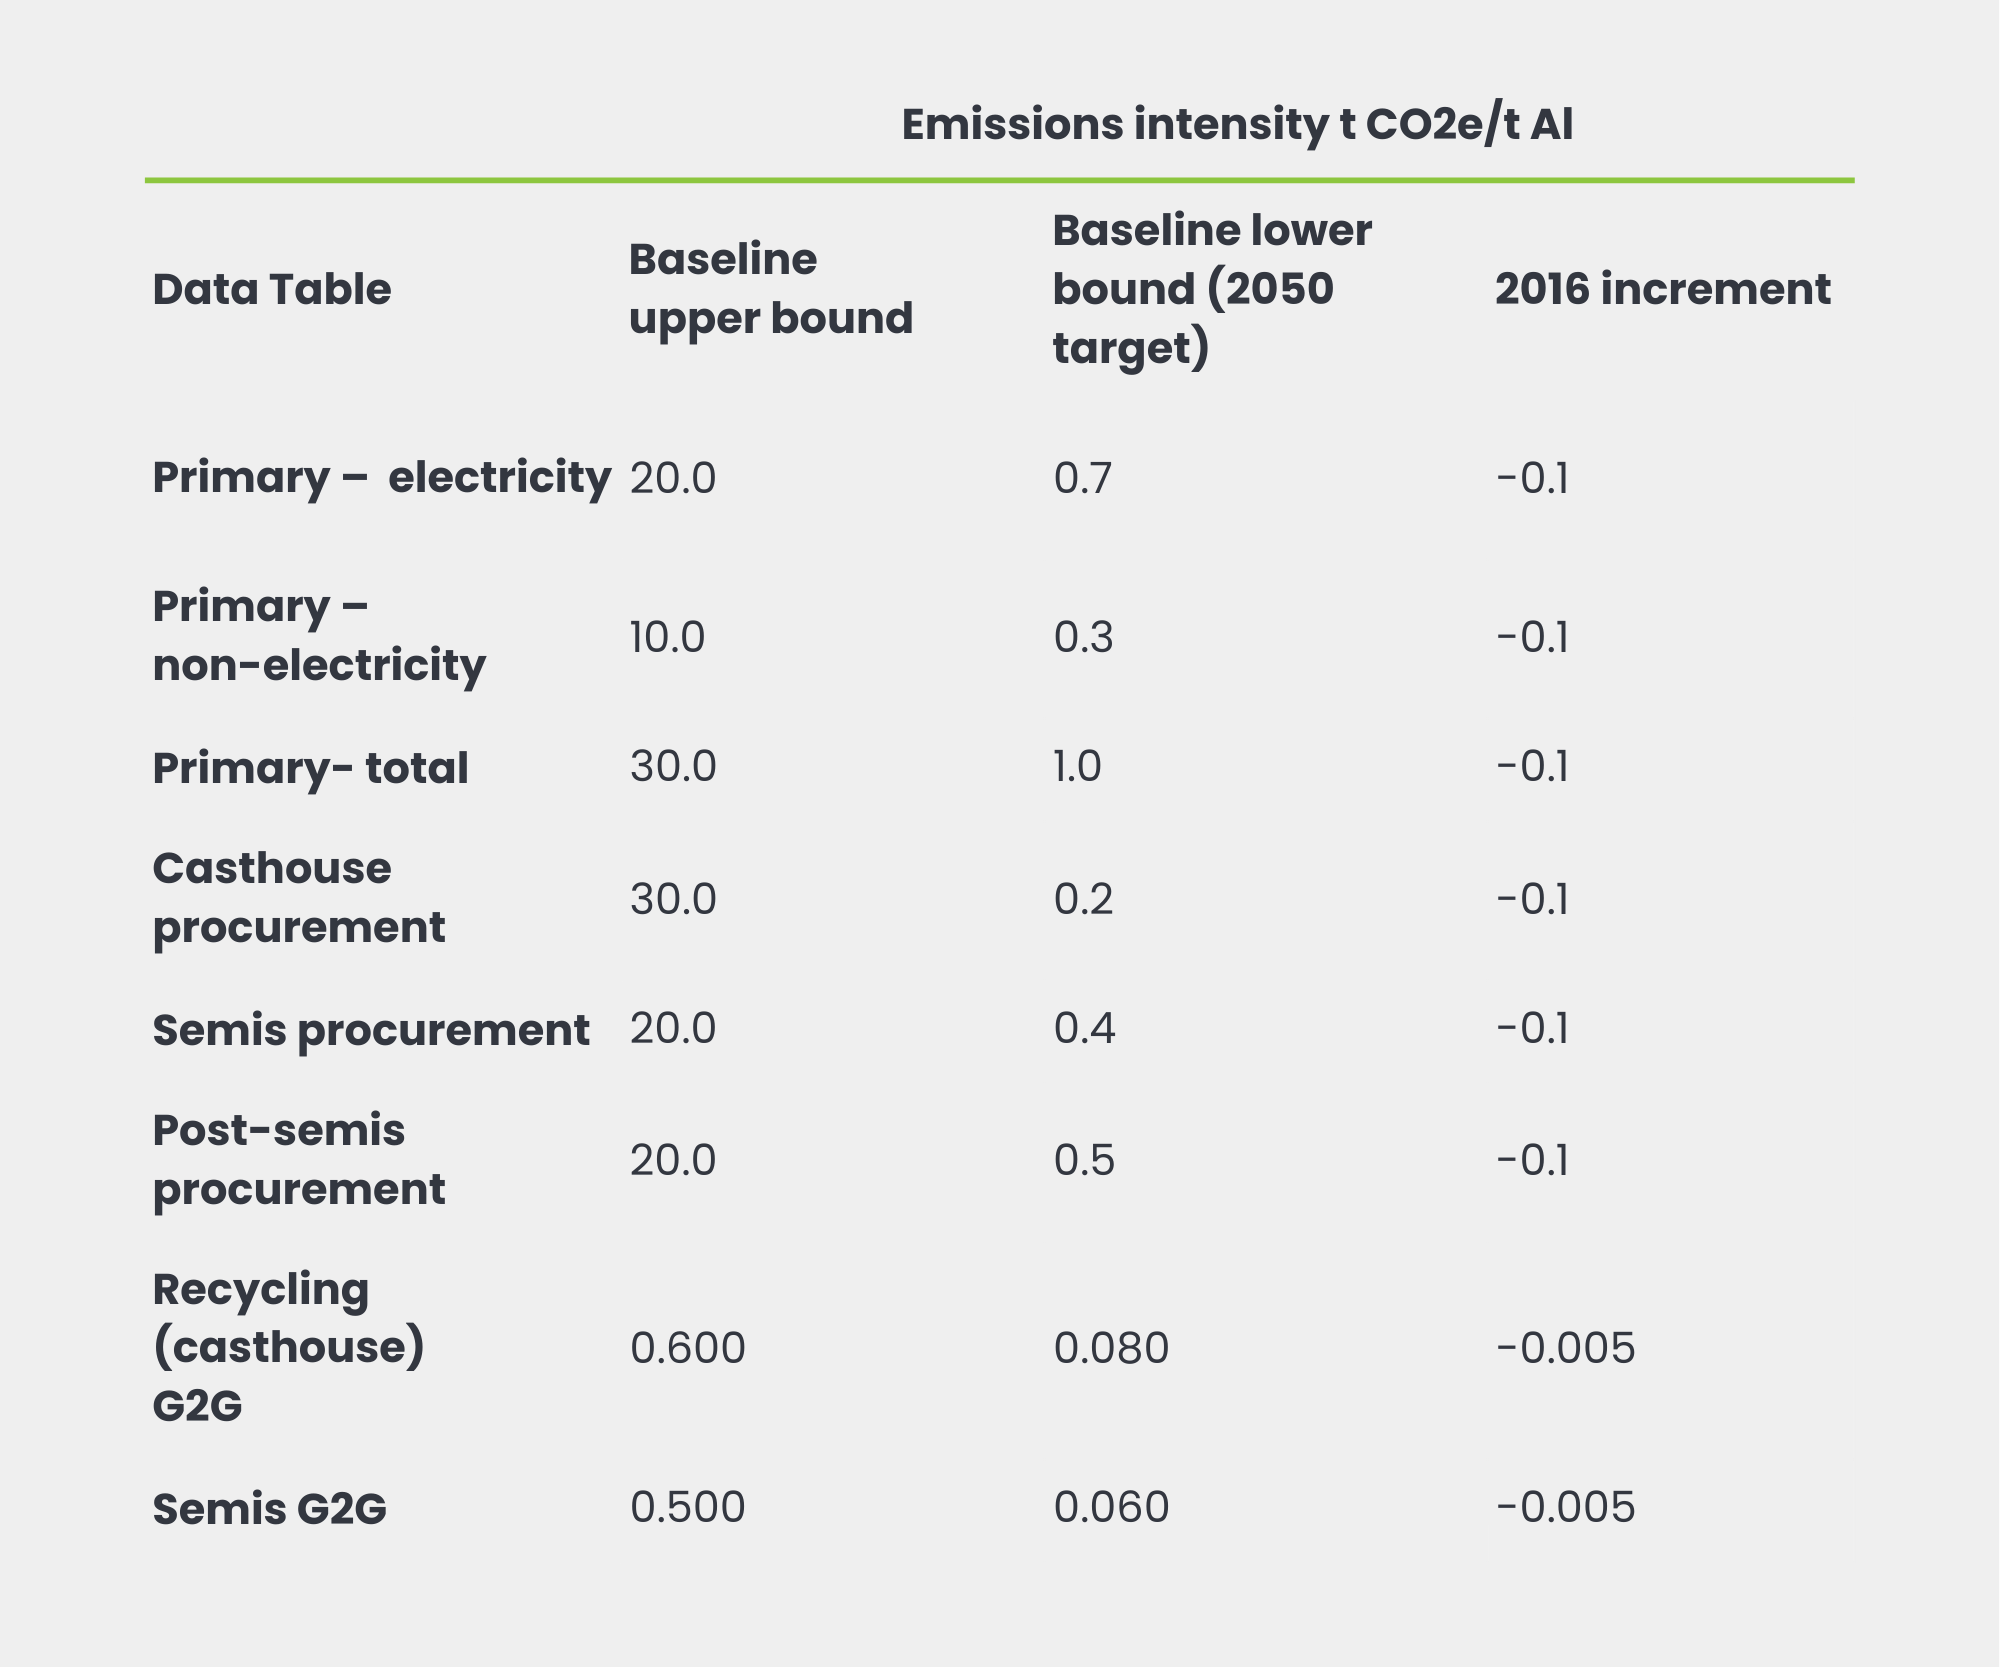
The archetypal slopes all converge on the same 2050 target intensity for each process or procurement category, but they start from 2016 values that reflect the range of current industry performance, set at given increments (see below). Thus, if the user data for casting or semis process (gate-to-gate – G2G), for instance, is input to 3 significant figures (0.001 t CO2e/t Al), the model looks for that value in an archetypal slope that is rounded to 0.005 t CO2e/t Al in 2016 – hence a slight difference in output value for the chosen base year.
It was felt that the following 2016 increments for each process slope were sufficient, but following feedback from testing Entities we may change the downstream process increments to 0.001 t CO2e/t Al.
This will not affect the shape of the slope or the convergence target, but it will give a closer baseline number to user input data, and a more tailored slope.
What additional refinements can we expect?
Mid 2024 will see official incorporation of the ASI-endorsed method into Performance Standard Guidance (all ASI Performance Standard Audits from the date of publication, currently planned for 1 June 2024, must seek evidence that the method has been used by the Certifying Entity), but the method and tool will continue to evolve with the science and lessons from implementation.
In addition to web-based tool development and improvements in slope increments, when ready, the results of research into bauxite and alumina specific methods and the impact of land use change emissions will be incorporated into the method and tool.
We will also respond to feedback in terms of functionality and user experience with the tool, so if you have any questions, comments or requests regarding the tool (or the wider method), please don’t hesitate to get in touch with ASI Climate Change and Decarbonisation Director, Chris Bayliss.
More information
- Consult the ASI Entity GHG Pathways Method – Document Centre under ‘Tools’
- Access the ASI Entity GHG Pathways Calculation Tool – – Document Centre under ‘Tools’
SHARE THIS ARTICLE