Issue Brief: Low Carbon Aluminium
Under a 1.5 degree scenario, the aluminium sector must reduce its GHG emissions from over a billion tonnes of CO2e to around fifty million tonnes by 2050. This is less than one-twentieth of current emissions.
23 February 2022
Total aluminium sector GHG emissions are currently 1.1 billion tonnes of carbon dioxide equivalent (Gt CO2e). This is 2% of all human-made emissions.
Here, ‘the aluminium sector’ means all processes, raw materials and energy used to produce semi-finished aluminium products (like sheet and extrusions), including both mined and recycled supply. Primary aluminium production (mining to ingot casting) is responsible for 95% of these emissions.
ASI Performance Standard Certified Entities (across all primary, recycling and semi-fabrication activities) are currently responsible for around 10% of aluminium sector emissions.
Global (semi-fabricated) aluminium demand is over 100 million tonnes of metal (Mt Al).
67 Mt is supplied with primary aluminium, over 20Mt with metal recycled from post-consumer scrap, and over 15Mt recycled from pre-consumer scrap (the latter at over 95% collection rate).
The lowest carbon primary aluminium currently on the market can only meet a maximum one third of current demand.
While ‘low carbon’ primary aluminium is not formally defined, a carbon footprint of less than 4 CO2e/t Al is a common reference, representing the very lowest achievable with currently available technologies. This carbon footprint is ‘Cradle to Gate’: broadly equivalent to GHG Protocol scope 1, scope 2 and scope 3 (categories 1,3 and 4) measured at the smelter casthouse. ASI uses the term ‘Mine to Metal’.
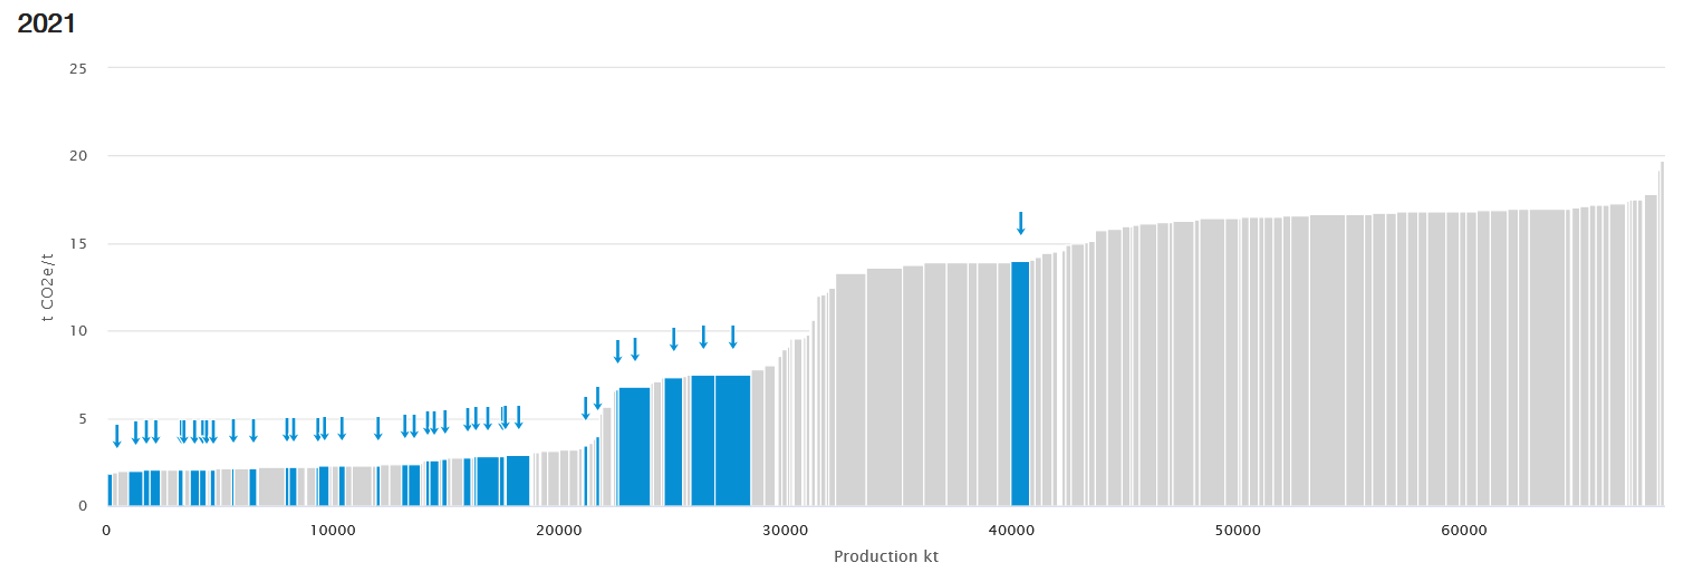
The chart below, generated using the CRU Emissions Analysis Tool, shows all 2021-operating aluminium smelters as individual bars. Production (kt Al) is shown on the horizontal axis and emissions intensity (t CO2e/t Al) on the vertical axis. Note that the emissions shown are ONLY a subset of cradle to gate emissions and do not include those processes upstream of the smelter. Hence, given that there is little variability in the emissions of such processes compared to smelters, approximately 2.6 t CO2e/t Al (predominantly alumina production and bauxite and alumina transport) should be added to all smelters for a full Mine to Metal number.
The lowest emission intensity smelters are shown at left, the highest at right, with the largest producing smelters having the widest bars. The smelters with the highest total emissions have the largest surface-area of bar. ASI Certified aluminium smelters are identified in blue.
Overall, smelters emitting less than 5 t CO2e/t Al cradle to gate, including upstream emissions produce around 20Mt of the 2021 67Mt total primary production.

Table 1 – Production and emissions intensity for all 2021-operating aluminium smelters.
Source: https://emissionsanalysistool.crugroup.com/
The area covered by each bar is a measure of the total emissions of each smelter, being the product of production and emissions intensity:
(kt Al) * (t CO2e/t Al) = (kt CO2e)
Under a 1.5 degree scenario, the aluminium sector must reduce its GHG emissions from over a billion tonnes of CO2e to around fifty million tonnes by 2050.
This is less than one-twentieth of current emissions.
There are differential decarbonisation slopes for primary aluminium production, semi-fabrication and recycling. All must decrease their emissions intensity by 80 to near 100% within the next 30 years.
| CO2e emissions intensity (tonnes per tonne) | 2018-2030 | 2018-2040 | 2018-2050 | ||||||
| 2018 | 2030 | 2035 | 2040 | 2045 | 2050 | ||||
| Primary Aluminium | 16.1 | 11.5 | 4.2 | 2.2 | 1.2 | 0.5 | -28% | -86% | -97% |
| Recycled Aluminium (Gate to Gate) | 0.6 | 0.5 | 0.4 | 0.2 | 0.1 | 0.1 | -22% | -59% | -82% |
| Semis Process (Gate to Gate) | 0.3 | 0.2 | 0.2 | 0.2 | 0.1 | 0.1 | -28% | -45% | -81% |
Sectoral pathways and technologies for GHG emissions reductions are being mapped out.
From the IAI’s analysis, there are three credible and realistic approaches to emissions reductions for the aluminium sector, broadly aligned with the International Energy Agency’s Net Zero and Beyond 2 Degree Scenarios.
- Electricity decarbonisation – Fully decarbonised power generation and the deployment of carbon capture utilisation and storage (CCUS) for non-renewables.
- Direct emissions – Electrification of fuel combustion processes, fuel switching to green hydrogen and CCUS, new technologies such as inert anodes for smelting, and reduction of transport emissions.
- Recycling and resource efficiency – Increasing collection rates to near 100% as well as other resource efficiency progress.
Recycled aluminium seems like an easy answer, but there are several reasons why it cannot fully meet aluminium demand today or in 2050.
Aluminium demand is increasing, to support energy transitions in other sectors. Aluminium applications can have long use lives in sectors such as transport and infrastructure and that metal is not available for recycling in the short term. For example, cars can have lifetimes of over 20 years, and buildings over 50 years.
Scrap from products at the end of their life is termed post-consumer scrap. Globally, post-consumer scrap is dominated by mixed scrap and castings; for example, cast engine blocks for internal combustion engines. The quality of this kind of scrap is not high enough for many rolled, forged and extruded aluminium applications.
Future demand growth for post-consumer scrap will be for use in rolled and extruded applications, particularly automotive sheet and profiles. As the automotive industry transitions to electric vehicles, there will be less demand for castings such as engine blocks.
Pre-consumer scrap is generated in production and manufacturing processes, at a generation rate that is broadly proportional to production. Under a 1.5 degree scenario, the processing of aluminium needs to be made more efficient by reducing pre-consumer scrap generation. The remelting and recycling of such scrap requires energy. Increasing production efficiencies will mean that availability of pre-consumer scrap should fall, if a 1.5 degree scenario is to be achieved.
Overall, the demand for well-sorted, high-quality scrap will increase. An oversupply of mixed and cast scrap is expected. High-quality post-consumer scrap will become a globally constrained resource, and regional and sector-specific availability will vary.
Emissions reductions require a whole of supply chain approach. At an Entity level, the ASI Performance Standard V3 (2022) mandates all Entities to develop 1.5 degree aligned pathways, with plans and targets, including scope 3, where relevant.
ASI’s aim is to drive GHG emissions reductions throughout the aluminium value chain. For Entities that source aluminium for their products, scope 3 is highly relevant and thus procurement will play a significant role.
Additional methodologies to support company-specific 1.5 degree aligned pathways are under development during 2022 by ASI and IAI, in co-operation with partners such as the Science Based Targets initiative, the Mission Possible Partnership and the Center for Climate Aligned Finance.
More information
RELATED TOPICS:
SHARE THIS ARTICLE


