Delivering on 1.5°C alignment: Quantifying emissions reductions from ASI certified Smelters
This analysis quantifies the potential GHG emissions savings between 2021 and 2030 by smelters within ASI Entities fully implementing 1.5oC aligned emissions reduction pathways.
24 February 2026
ASI Performance Standard (PS V3) sets a clear expectation for 1.5oC aligned aluminium company action. Criterion 5.3 requires certifying Entities, no matter where they sit on the value chain, to establish a GHG Emissions Reduction Plan and follow a reduction pathway consistent with a 1.5oC scenario, using the ASI Method.
Scope of analysis
- 30 ASI PS V3 certified Entities with smelting activities within their certification scopes
- Observed emissions: 2021 – 2024
- Forecast period: 2025 – 2030
This analysis quantifies the potential GHG emissions savings between 2021 and 2030 by smelters within ASI Entities fully implementing 1.5oC aligned emissions reduction pathways. It combines modelled emissions under business-as-usual and 1.5oC aligned pathway scenarios with observed emissions for the period 2021-2024
Results
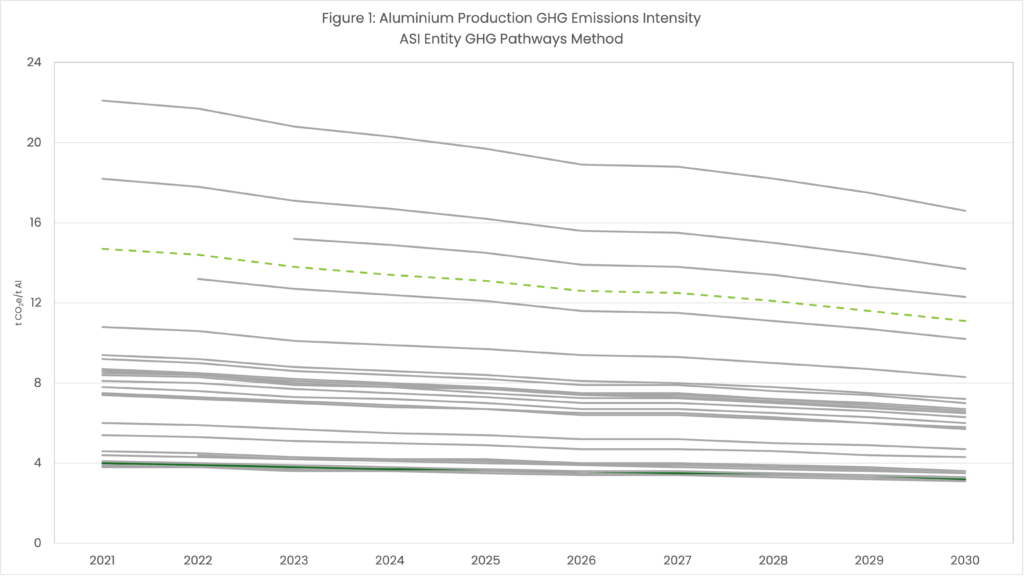
Figure 1: Aluminium Production GHG Emissions Intensity calculated using ASI GHG Method for 30 PS V3 certified Entities
The estimated emissions intensity pathways of ASI certified Entities with smelting activities within their certification scopes (Fig 1) show diversity in 2021, a common baseline year, with seven Entities choosing a later starting point and only one before (not visible on the chart). The ASI Method allows baseline year choice as early as 2016. Baseline emissions intensities (cradle to gate) range from 3.8 to over 22.1 t CO₂e per tonne of aluminium. Following a 1.5 °C-aligned pathway, the expected 2030 emissions intensities for this cohort declines to 3.1 t CO₂e/t Al at the lowest to 16.6 t CO₂e/t Al at highest.
Overall, the analysed ASI certified Entities sit below the sector level emissions intensities (green dashed line, IAI Aluminium Sector Greenhouse Gas Pathways to 2050 – International Aluminium Institute). This reflects the application of Criterion 5.2, which excludes from certification coal-fired smelters unable to meet an aggressive 2025 and 2030 reduction slope (essentially the global average) that is steeper than a 1.5 degree aligned sectoral decarbonisation approach. Nevertheless, three certified Entities do sit above the sector average, reflecting site specific circumstances, with one having coal-fired operations. These smelters will need to achieve 11 t CO2e/t Al by 2030, in order to remain ASI PS criterion 5.2 conformant.
The results demonstrate the potential for gradual decarbonisation for Entities considered in the analysis, if the pathways are followed in line with the ASI PS criterion 5.3.
Under the IAI 1.5 °C-aligned pathway, annual emissions from the global aluminium sector are expected to decline by almost 30% by 2030 compared to 2018 levels, corresponding to a reduction of approximately 350 Mt CO₂e in annual emissions relative to 1,100 Mt in 2021.
For comparison, a BaU scenario was designed assuming intensities remain constant and are applied to projected production volumes, which results in increasing total emissions over time in absence of decarbonisation action. Against this, the results of this analysis using the ASI Method indicate average emissions reductions of approximately 28 Mt CO₂e per year over the nine-year period (2021-2030) for the 30 ASI PS V3 certified cohort in relation to BaU.
Aggregated across all Entities and years, the cumulative emissions reduction would be a saving of nearly 255 Mt CO₂e between 2021 and 2030. This is achieved assuming no reduction in production volumes, highlighting improvements in emissions intensity alone.
Observed emissions 2021-2024
Comparing actual emissions from 2021 – 2024 with both modelled scenarios enables an assessment of whether Entities are already progressing in line with their modelled 1.5oC aligned pathways.
Cumulative actual emissions over this period were approximately 3 Mt CO2e higher than the modelled pathway-aligned scenario, but 36 Mt CO2e lower than the BAU.
To complement the absolute emissions, production-weighted average emission intensities were also calculated for the period 2021-2024 under BAU, 1.5oC aligned pathway and based on actual observations. Over this period, the average observed intensity was 8.2 t CO2/ t Al, compared to 8.5 CO2/ t Al under BAU, and 8.1 CO2/ t Al under ASI pathway.
Given that the 1.5oC aligned pathways were defined retrospectively based on a common baseline year (the ASI Method was published in 2024), the comparison should be interpreted as an ex post assessment rather than an evaluation of formal compliance. The proximity of observed emissions to the pathway aligned scenario suggests that recent emissions intensity improvements are broadly consistent with the level of reductions proposed by the ASI Method. However, the remaining gap relative to the pathway (3 Mt CO2e) indicates that additional reductions will be required from 2025 onwards to maintain alignment through 2030 and beyond.
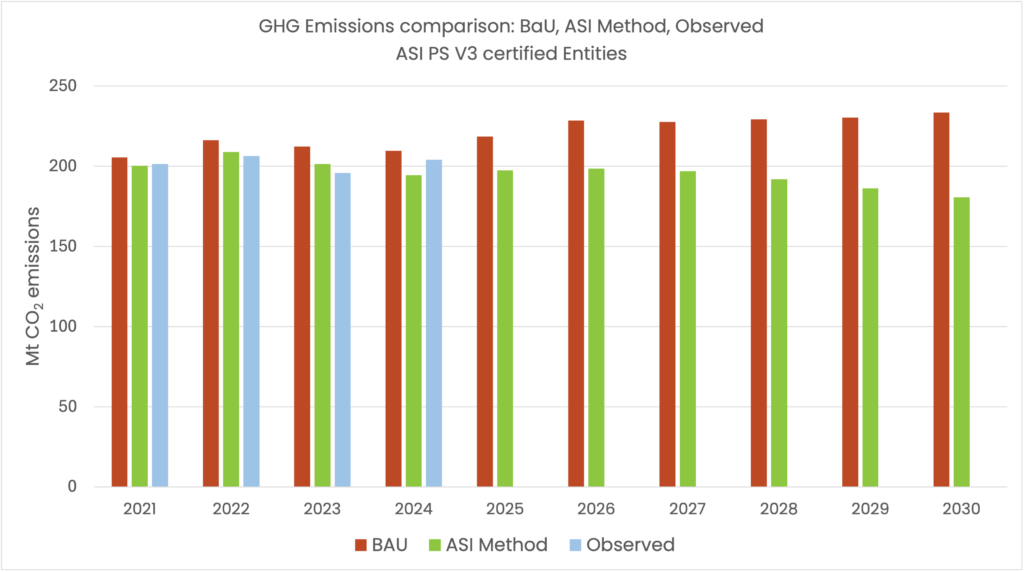
Figure. 2. Total annual GHG emissions for 30 ASI certified Entities certified with ASI PS V3 under BaU scenario, a 1.5oC-aligned emissions reduction pathway, and observed emissions for the period 2021-2024.
The comparison between BaU, pathway-aligned and observed emissions (Fig 2) highlights differences between no action, and 1.5oC consistent actions. Under BaU, total emissions increase over time as production volumes grow and emissions intensities remain unchanged. Whereas emissions under the ASI 1.5oC aligned pathway decline as intensity reductions are applied. Observed emissions provide a reference for assessing early progress relative to both modelled scenarios, while pathway and BaU trajectories illustrate projected outcomes through 2030. Observed emissions lie close to pathway-aligned trajectory and in some year (2022 and 2023), are marginally lower than the pathway.
Implications
The scale and timing of emissions intensity improvements vary by Entity type and baseline emissions profile. For higher emitting Entities, significant reductions are critical in the early years, while for lower emitting entities, more substantial reductions are expected to occur in the post-2030 period. These differences highlight how transparent disclosure and effective implementation rather than the existence of plans alone remain essential to demonstrate real progress along defined reduction pathways.
The comparison of observed emissions with modelled scenarios demonstrate that emissions reductions relative to BAU are already occurring within ASI cohort, broadly in line with ASI method slopes. At the same time, continued monitoring and effective implementation remain essential to ensure that forecast reductions translate to real emissions outcomes over time.
Conclusions
This analysis demonstrates that ASI Performance Standard disclosure requirements enable a level of transparency sufficient to quantify emissions trajectories and assess alignment with 1.5oC consistent pathways across ASI PS V3 certified Entities. The availability of emissions data and reduction targets make it possible to evaluate actual outcomes.
ASI certified Entities are setting 1.5oC aligned emissions reduction pathways and, in aggregate, the majority are broadly following these trajectories. Absolute emissions within certified cohort are declining relative to BaU scenario, confirming emissions intensity improvements are being translated into measurable emissions reductions.
Looking ahead, ASI recognizes both the progress achieved to date and consideration that this analysis represents a minority share of the total global aluminium sector emissions. With that, future iterations of the ASI Performance Standard will need to build on mitigation efforts while also addressing the emissions that cannot be avoided. This recognition underpins the development of ASI PS V4, currently under consultation, which is expected to place increased emphasis on emissions removals alongside mitigation, with any emissions that are not reduced will need to be neutralised for the sector to remain aligned with a 1.5oC outcome.
Method
To estimate avoided emissions, a business as usual scenario and a 1.5 oC aligned scenario were modelled and the two compared. The analysis required three key data inputs: baseline smelter GHG emissions intensity for each Entity (cradle to gate), primary aluminium production volumes for the period 2021- 2024 and forecast for 2025-2030, and 1.5oC aligned emissions intensity pathways generated using the ASI Entity GHG Pathways Method and Calculation Tool..
Emission baselines
Data from 30 Entities was analysed, baseline smelter emissions intensities ranging from 3.8 to over 22.1 CO₂e/t Al. The variability in these values essentially reflects the diversity of power mix for the smelting process, although some variability is due to differences in efficiency at each process stage and feedstock carbon footprint.
This wide range is consistent with sector-wide variability reported by the International Aluminium Institute, which shows that cradle-to-gate emissions for primary aluminium fall in the range of 4 – 22 t CO₂e/t Al depending on production and electricity mix. Coal-fired smelting remains significantly more carbon intensive than smelters supplied with hydropower or other low-carbon energy sources.
In general, as can be seen in Figure 3, ASI Entities represent lower emitting smelters, in part due to the threshold cut off of criterion 5.2 excluding new coal-fired production.
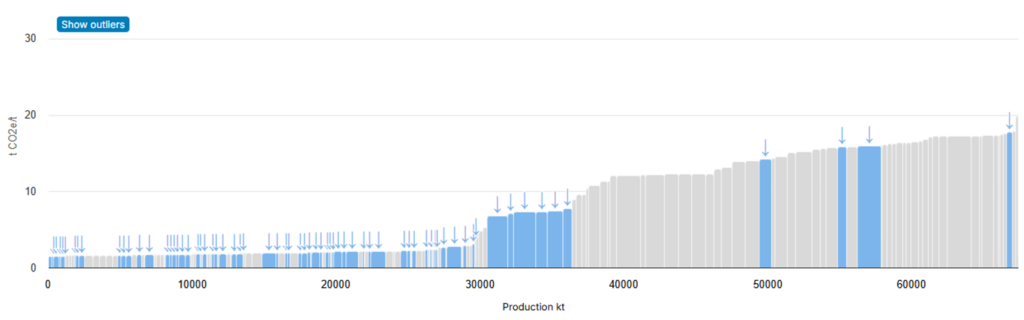
Figure 3: Production and emissions intensity for all 2021-operating aluminium smelters. Source: CRU Asset Services. Note the y-axis on this chart doesn’t correspond to the y-axis on Fig 1 as refer to different emissions scopes.
Baseline data were derived from publicly disclosed sources, where available, with a preference for 2021 as the baseline year. When 2021 data were not disclosed, as required for Entities under the ASI performance Standard V3, the closest available reporting year was used. When public disclosures were unavailable or incomplete, smelting process values were sourced from CRU Asset Services, with assumptions for upstream (predominantly alumina) processes, ranging from 1.3 to 2 t CO₂e/t Al, broadly depending on location and using ASI in-house intelligence.
While conformance with ASI PS criteria 5.1 (public disclosure of GHGs) and 5.3 (emission reduction targets) indicate that such data should be publicly available, gaps remain. In several cases, Entity level decarbonisation pathways and associated data were not publicly available because the ASI Method had not yet been published at the time the Entities obtained their certification. For others differences in reported emission scopes, protected access, or use of corporate level reporting required the use of alternative data source and assumptions.
Access to this data is thanks to the Memorandum of Understanding signed between CRU (the global mining, metals and fertiliser business intelligence company) and ASI to enable sustainability data integration providing a more comprehensive view of the information on assets in the aluminium value chain (CRU Group | Asset Platform)..
Production volumes
Annual production volumes for 2021 – 2030 were sourced from CRU and applied consistently across both scenarios.
ASI 1.5°C Reduction Pathway
The ASI Method was used to generate 1.5°C aligned emissions intensity reduction pathways for each Entity, based on baseline year emissions intensity, as Entities usually disclose only baseline year data and targets, but do not publish detailed reduction pathways.
Emissions scenarios
To translate intensity pathways into absolute emissions, two scenarios were modelled for each Entity and year from 2025 to 2030.
- Pathway aligned scenario
Annual production volumes were multiplied by the corresponding pathway aligned emissions intensity, representing emissions if Entities implement planned reductions.
- Business as usual scenario (BAU)
Production volumes were multiplied by the 2025 emissions intensity, assuming no change through 2030. This scenario shows emissions in the absence of decarbonisation action.
The difference between these two scenarios represents potential reductions of emissions to the atmosphere due to pathway alignment.
In addition to the two modelled scenarios, actual emissions for the period 2021-2024 were calculated using one of three approaches depending on the data availability:
- Direct use of publicly disclosed emissions reported by Entities
- Calculation of emissions using emissions intensities disclosed by Entities, combined with production volumes sourced from the CRU platform.
- Calculation of emissions using emissions intensities and production volumes sourced from the CRU platform where Entity-level disclosures were not available.
This provides a reference point against which the BAU and pathways-aligned scenarios can be assessed, allowing identification of early emissions reductions prior to 2025.
SHARE THIS ARTICLE