10 Years of Impact: What ASI’s Audit Non-Conformance Data Reveals About Sustainability Progress
Our analysis of Non-Conformances (NCs) across ASI Performance Standard (PS) version 2 (V2) and version 3 (V3) since thew launch of the Certification Program until end of 2024, reflects the broader journey of continuous improvement – identifying common challenges, progress made, and opportunities for further improvement
27 May 2025
Overall System Performance
Across active certifications, the majority of criteria are rated as being in ‘Conformance’ (83%), while Non-conformances represent 5%, and 12% of criteria are indicated as ‘Not applicable’ to specific audit scopes. Conformance ratings reflect the diversity of operations and the continued journey toward full implementation of the ASI Performance Standard criteria.
Methodology
Analysis period: First PS V2 Certification (achieved in 2018) to 31 December 2024
Population size: All ASI PS Certifications since the ASI Certification Program Launch in 2018
ASI Standard: ASI PS V2 and ASI PS V3
Total number of current ASI PS Certifications: 295
- ASI PS V2: 143
- ASI PS V3: 152
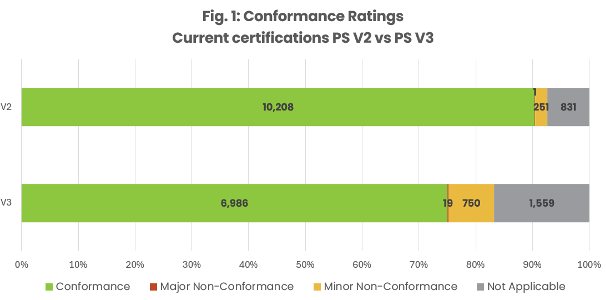
Considering current active certifications, audits have identified a total of 1021 NCs across Performance Standard V2 and V3. Version 2 of the Standard shows significantly fewer NCs, since 65% of the active PS V2 certifications are not first-time certifications. These Entities have already undergone Surveillance Audits or Re-Certification, giving them time to improve their practices.
These findings span all ESG issues and reflect ASI’s four sustainability priorities: Climate, Circularity, Nature, and Social Value. The most common issues flagged relate to emissions, and human rights—areas that align with emerging expectations around climate action and social responsibility.
This is further seen in the breakdown of NCs by ESG issue as illustrated in Figures 2 and 3. They show a shift in the distribution of NCs, now with a larger share related to social issues under PS V3 (both First PS V3 Certification and Re-Certification from V2). Additionally, within each ESG issue, the most frequently recorded NCs also changed. For example, under Environment most common Principle under V2 was Principle 6 (Emissions, Effluents and Waste), while under V3 it is Principle 5 (Greenhouse Gas Emissions). For Social issues, most NCs shifted from Principle 11 (Occupational Health & Safety) (V2) to Principle 9 (Human Rights) (V3). Under Governance, Principle 2 on Policy Management receives the most NCs under both versions.
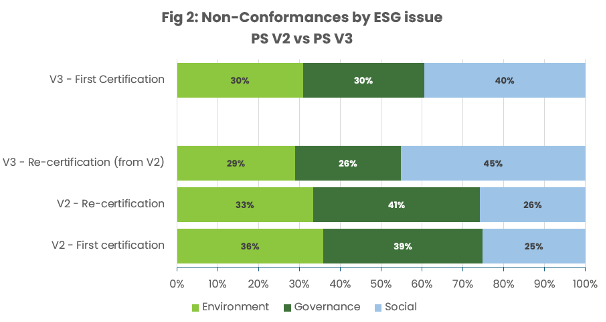
Distribution of NCs across ESG issues and ASI sustainability priorities for ASI PS V2 and V3, based on total number of NCs recorded under each version and audit type.
Social issues have increased the total share of NCs from V2 to V3. While it appears that NCs under Governance (Management System) and Environment (Circularity, Nature) record lower incidences, compared to a higher share under V2, this reflects the relative distribution of NCs, and not their numbers per certificate. When normalised by the number of certificates, NCs across all ESG issues are actually higher under V3, except Principle 7 (Water Stewardship) which is the same.
Re-certifications in V3 are for those Entities that transitioned from V2 to V3. At the time of the analysis there were still no first audit certifications under V3 that were re-certified.
Non-Conformances Are Not Failures—They’re Catalysts for Change
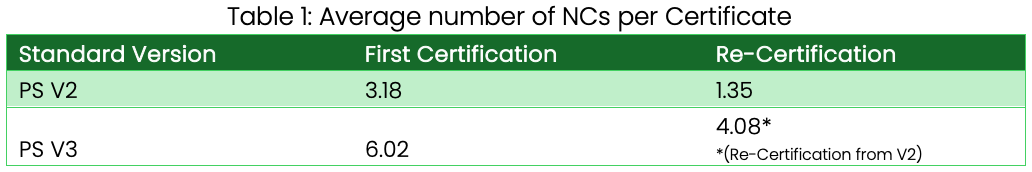
The average number of NCs per certificate varies significantly depending on the type of audit (see Table 1). First-time certifications tend to result in higher numbers of NCs, particularly under V3, which introduced expanded and more demanding criteria, setting a higher bar for sustainability performance across the aluminium value chain. Re-Certifications, by contrast, show lower averages, reflecting the role of audits in driving continuous improvement.
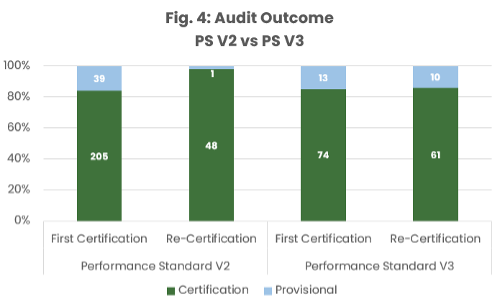
This trend is further supported by the number of provisional certificates issued at Re-Certification audit (Figure 4). While the share of Provisional Certifications for First Certification under both versions is similar, Re-Certifications under V3 (from V2), show a higher proportion of provisional outcomes. This again reflects the increased rigour, where even long-certified Entities are required to strengthen their performance.
To further understand where implementation challenges are concentrated, Figures 5 and 6 present both major and minor NCs across all 11 Principles of the ASI Performance Standard, enabling insights into the differences between First and Re-certification audit performance (PS V2 & V3 combined).
For First Certifications, the highest number of NCs was recorded under Principle 2 Policy and Management, followed by Principle 9 Human Rights and Principle 6 Effluents and Waste. While for Re-Certifications, it shifted towards Principle 9, followed by Principle 10 Labour Rights and Principle 2.
Additionally, Figure 6 shows normalised NCs per Certificate with lower numbers at Re-Certification for almost all Principles. In most cases, Re-Certification shows NCs reducing. However for Principle 10 Labour Rights, NCs are higher for Re-Certifications, with Principle 3 Transparency and 9 Human Rights showing only slight reductions. This suggests that during Re-Certification, this Principle is encountering increased challenges in meeting the requirements, probably attributable to the increased requirements from V2 to V3 in these sections, for example in criteria 9.8 and 10.3 as noted in Figure 8 below.
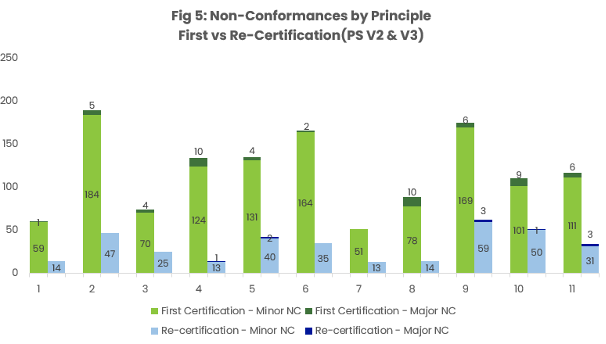
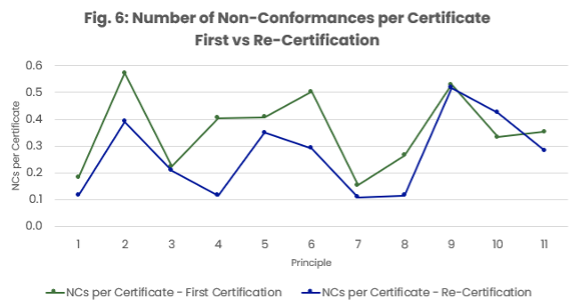
Figure 5
Number of Non-conformances under First Certification and Re-Certification audits, PS V2 & V3, categorised by Principles.
Number of all First Certifications: 331
Total number of NCs: 1299
Number of all Re-Certifications: 120
Total number of NCs: 351
Figure 6
Number of NCs per Certificate, PS V2 & V3, categorised by Principle.
Principle 1: Business Integrity; Principle 2: Policy & Management; Principle 3: Transparency; Principle 4: Material Stewardship; Principle 5: Greenhouse Gas Emissions; Principle 6: Emissions, Effluents and Waste; Principle 7: Water Stewardship; Principle 8: Biodiversity and Ecosystem Services; Principle 9: Human Rights; Principle 10: Labour Rights; Principle 11: OH&S
To break it down by version and understand the key areas where companies most often fall short, we highlight the top criteria with the highest number of NCs for each version (Figure 7 and 8). These represent common implementation challenges—and crucial opportunities for improvement and impact.
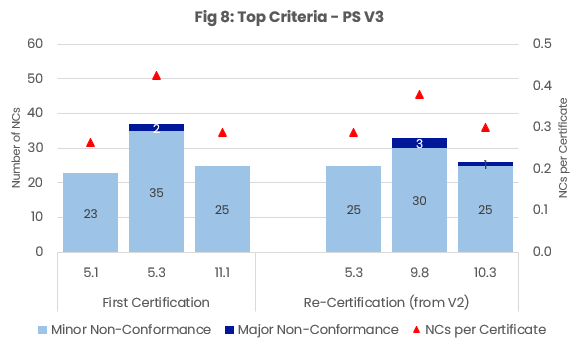
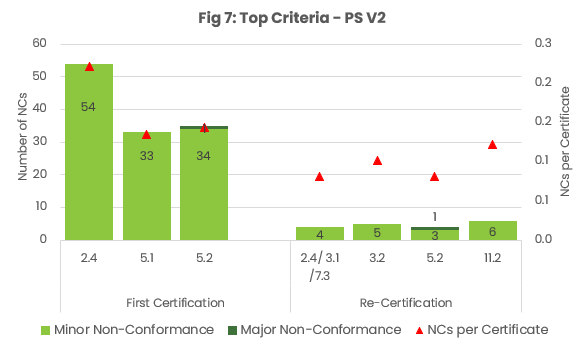
Criteria with the highest number of NCs under First and Re-Certification audits for V2 and V3.
Figures present total number of NCs as well as numbers per Certificate.
Criteria:
2.4 Responsible Sourcing ; 3.1 Sustainability Reporting; 3.2 Non-compliance and Liabilities; 5.1 Disclosure of GHG Emissions and Energy Use; 5.2 GHG emissions reductions (V2 – criterion changed in V3); 5.3 GHG Emissions Reduction Plans; 7.3 Disclosure of water usage and risks (V2 – criterion changed in V3); 9.8 Conflict-Affected and High-Risk Areas; 10.3 Forced Labour; 11.1 Occupational Health and Safety (OH&S) Management System; 11.2 Employee engagement on Health and Safety.
Summary and What’s Next?
Over the past decade, ASI drove a steady evolution in sustainability performance among its certified Members. The transition to more rigorous V3 of the ASI Performance Standard gradually replaced V2, raising higher expectations and fostering deeper improvements.
The data suggest that even when not always directly measurable, ASI certification plays a key role in driving change. Each Non-Conformance highlights gaps in practice, and addressing these gaps strengthens the foundation for sustainability across the aluminium value chain.
With every version of the Performance Standard, ASI continues to raise the bar. As we move into the next decade, transparency, accountability, and continuous improvement will remain central to how we drive sustainability action.
Previous analyses of Non-Conformances
- D&R Insights: Non-Conformances increase with strengthened ASI Performance Standard V3 | Data & Research Insights | Aluminium Stewardship Initiative – October 2023
- D&R Insights: Distribution of ASI Non-Conformances by region | Data & Research Insights | Aluminium Stewardship Initiative – January 2023
- D&R Insights: Latest ASI Non-Conformance data | Data & Research Insights | Aluminium Stewardship Initiative – September 2022
- M&E Insights: Progress on Addressing Non-Conformances | Aluminium Stewardship Initiative – June 2021
- M&E Insights: ASI Performance Standard Conformance Ratings | Aluminium Stewardship Initiative – May 2021
RELATED TOPICS:
data and researchnon-conformances
SHARE THIS ARTICLE