Closing the Aluminium Loop: Insights from the 2025 Circularity Gap Report
Global circularity is declining, with only 6.9% of material inputs coming from recovered sources, according to the Circularity Gap Report 2025. For aluminium, trends in the Circularity Metric, Net Additions to Stock, and Waste Destined for Circularity show both progress and persistent gaps.
26 August 2025
Only 6.9% of the more than 100 billion tonnes of materials and energy carriers consumed annually come from circular sources – that is the stark fact highlighted in the latest Circularity Gap Report (CGR) 2025. Recycled metals, plastics and aggregates, composted organics, and biogas – all these recovered materials currently meet only a fraction of global demand, and that share has been decreasing.
Despite increased recovery of waste materials between 2015 and 2021, the global circularity rate (across all materials) fell by a quarter over the same period. This concerning trend reflects the economy-wide challenge of decoupling socio-economic development from resource extraction – a challenge the aluminium sector must face as it seeks to accelerate alignment with circular economy principles.
Aluminium is a material with inherent qualities that can be used in recyclable and durable products. However, it is important not to assume that all aluminium products are inherently circular simply because the metal itself is recyclable. Such assumptions can delay necessary improvements or, in some cases, result in product systems and business models that lead to unintended negative circularity outcomes.
CGR 2025 introduces a Circularity Indicator Dashboard, built around 11 system-level indicators, which provides a structured way to evaluate progress. Three of these indicators are particularly relevant to the aluminium sector: the Circularity Metric, Net Additions to Stock, and Waste Destined for Circularity.
| Definition | |
|---|---|
| Circularity Metric | Share of secondary material inputs (e.g. recycled content) in total material inflows (e.g. final products entering the economy). |
| Net Additions to Stock | Materials embedded in long-lived products (e.g. buildings, vehicles, infrastructure) that are not returned to the economy within the accounting year. It reflects the balance between materials added to and removed from stocks through demolition or disposal. |
| Waste Destined for Circularity | Share of total waste flows that are directed to recycling, composting, or other forms of material recovery, rather than landfill or incineration without energy recovery. |
According to CGR 2025, the global circularity rate declined by over 2 percentage points between 2015 and 2021. Over the same period, Net Additions to Stock increased by more than 12 percentage points, and waste recovery levels remained largely unchanged. The CGR’s 2032 global target of 17% circularity is based on modelled outcomes where key sectors adopt material efficiency strategies.
For each of these three key indicators, let us compare global economy-wide findings with aluminium-specific trends and explore the implications for the sector.
1. Global Circularity Trends vs. Aluminium Progress
CGR 2025 confirms that circularity has declined over the last decade. Between 2015 and 2021, the global Circularity Metric fell by almost a quarter, from over 9% to under 7%. Waste recovery (waste destined for recycling) remained around 11%, while Net Additions to Stock increased significantly, from 25% to almost 40% over the same period – a function of increasing demand for materials in relatively long (but not necessarily increasing) product lifetimes. The following figures visualise the trends for each indicator, with dotted lines showing the 2032 or 2050 targets, highlighting the gap between actual performance and desired trajectories.
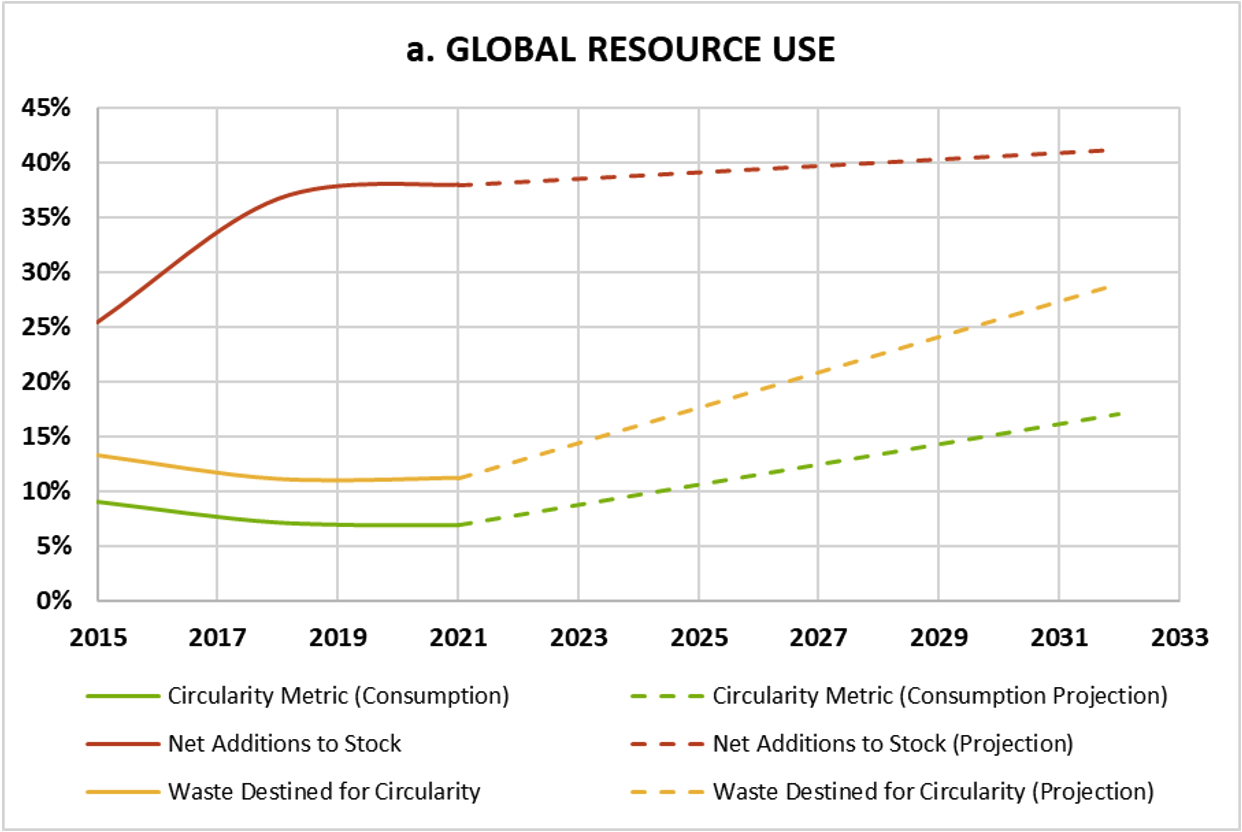
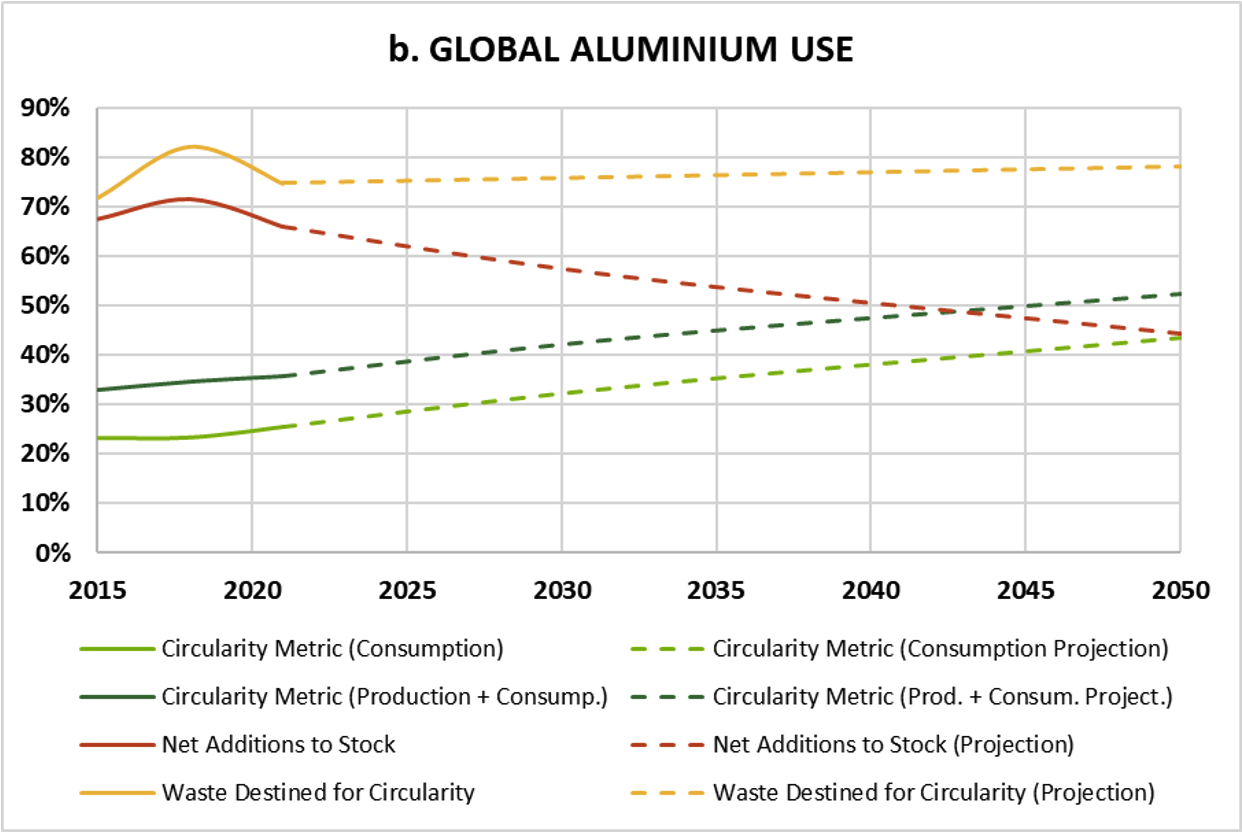
Figure 1. GLOBAL CIRCULARITY INDICATORS 2015-2032. (a) All resources. (b) Aluminium
Table 1 summarises the global trends for the three CGR indicators, showing actual performance for 2015–2021 alongside the 2032 targets.
Table 1. GLOBAL RESOURCE USE CIRCULARITY
| N | 1 | 2 | 3 | |
|---|---|---|---|---|
| Indicator | Circularity Metric (Consumption approach) |
Net Additions to Stock |
Waste Destined for Circularity |
|
| MFA* Stage | Inflow | Stock | Outflow | |
| 2015 | Rate (%) | 9.1% | 25.5% | 13.4% |
| Scale (Gt) | 8.4 | 21.5 | 8.4 | |
| 2018 | Rate (%) | 7.2% | 36.7% | 11.1% |
| Scale (Gt) | 7.1 | 36.6 | 7.1 | |
| 2021 | Rate (%) | 6.9% | 38.0% | 11.2% |
| Scale (Gt) | 7.3 | 40.3 | 7.3 | |
| 2032 | Rate (%) | 17.0% (**) | 41.2% | 28.9% |
| Scale (Gt) | 14.3 | 34.6 | 14.3 | |
* MFA: Material Flow Analysis
** The 2032 goal stems from Circle Economy’s 2021 research, which found that material use could be reduced by approximately one-third and circularity boosted to 17% through sector-specific interventions. It also aligns with a climate scenario pathway compatible with limiting warming to 1.75°C by 2032, supporting the Paris Agreement goal of staying well below 2°C.
In contrast, aluminium in products shows a different trend (Table 2).
Table 2. GLOBAL ALUMINIUM CIRCULARITY*
| N | 1 | 1.1 | 2 | 3 | |
|---|---|---|---|---|---|
| Indicator | Circularity Metric (Consumption approach) |
Circularity Metric (Production + Consumption) |
Net Additions to Stock |
Waste Destined for Circularity |
|
| MFA Stage | Inflow | Inflow | Stock | Outflow | |
| 2015 | Rate (%) | 23.3% | 32.9% | 67.6% | 72.0% |
| Scale (Mt) | 16.4 | 28.3 | 47.4 | 16.4 | |
| 2018 | Rate (%) | 23.4% | 34.6% | 71.5% | 82.2% |
| Scale (Mt) | 19.2 | 33.5 | 58.5 | 19.2 | |
| 2021 | Rate (%) | 25.4% | 35.7% | 66.1% | 74.8% |
| Scale (Mt) | 22.1 | 37.6 | 57.5 | 22.1 | |
| 2032 | Rate (%) | 33.5% | 43.4% | 56.0% | 76.1% |
| Scale (Mt) | 37.5 | 57.8 | 62.6 | 37.5 | |
| 2050 | Rate (%) | 43.5% | 52.4% | 44.4% | 78.3% |
| Scale (Mt) | 64.2 | 91.6 | 65.6 | 64.2 | |
* Source: Data drawn from the International Aluminium Institute (IAI) Alucycle Model – 2024 Reference Scenario. To be consistent with the CGR methodology, the Circularity Metric shown here does not account for recycling efficiency, which averages around 95%.
Aluminium consistently performs above the global materials average across all three indicators. Although it represents a small share of total material flows and stocks by mass (both around 0.1%), its role in the economy is disproportionately large, including its contribution to mobility, construction, energy systems, and packaging. Moreover, its production is responsible for approximately 3% of global fossil fuel-related CO₂ emissions, highlighting its relevance for both resource efficiency and climate strategies. Nevertheless, further improvement will depend on how circularity is integrated throughout the value chain.
2. Sectoral Insights from the Data
2.1 Circularity Metric (Consumption Approach)
While globally, the Circularity Metric declined between 2015 and 2021, over the same period, aluminium increased by a tenth from 23% to 25%. The sector has set a target of 44% by 2050, which would nearly double today’s performance. This level of ambition signals a growing alignment with circular principles but reaching that target will require sustained effort.
The consumption-based metric includes only post-consumer scrap. To better reflect circular flows, a complementary indicator (the Production + Consumption approach) captures both pre- and post-consumer material. In this case, aluminium reached a rate of 36% in 2021. Pre-consumer scrap is generally high quality and easier to recycle, with recovery rates for aluminium close to 100%. However, its presence in the system (as a non-product material flow) also reflects inefficiencies. While it is necessary to recover and recycle this material, strategies should prioritise reducing the generation of manufacturing scrap through improved process efficiency, quality control and product design.
Overall, the data shows that the sector is making progress, but continued advancements in design, infrastructure, and regulatory frameworks will be necessary to close the gap.
2.2 Net Additions to Stock
This indicator reflects annual increases in materials embedded in products in use (or dormancy) and is a reflection of increased demand but, more significantly, demand for long lifetime applications, such as those in buildings or infrastructure. While globally the share of materials entering long-lived applications has grown, from 26% in 2015 to 38% in 2021, aluminium has shown a declining trend, with projections reaching 44.4% by 2050, from 67.6% in 2015 (Note: In MFA, long-lived applications are usually those that stay in the economy longer than 1 year).
A lower share in this indicator could mean that more aluminium is re-entering circulation sooner. However, realising this potential depends on how existing stocks are designed, maintained, and eventually recovered. Design for disassembly and long-term tracking of materials in use will play an increasing role in enabling future circularity. While some materials used in infrastructure (e.g. roadbase) remain locked in use well beyond the modelling timeframe, aluminium’s trend may also reflect shifting dynamics in major markets such as China — where shorter building lifespans and large-scale infrastructure renewal are resulting in faster return of material to recycling systems.
2.3 Waste Destined for Circularity
Aluminium significantly outperforms the global average: 75% in 2021, compared to 11% globally. This difference reflects both high collection rates and the relatively low mass of aluminium compared to high-tonnage, low-recovery materials like aggregates. By 2050, the rate could reach 78%. Still, the absolute volume of aluminium waste rose by 34% between 2015 and 2021. This suggests a need to address production efficiency and scrap quality – aspects that are shaped significantly during the design phase, not only at end of life.
Additionally, most aluminium recycling still depends on industrial sources. Only a small share of global recycled material originates from households. Closing this gap will require expanded post-consumer collection systems and accessible infrastructure, particularly in low-income regions.
3. Implications for the Aluminium Sector
The CGR 2025 suggests that while recycling is necessary, it is not sufficient to meet circularity goals. Strategies to increase circularity must also include lowering demand for virgin inputs, extending product lifespan, and increasing system-wide resource efficiency.
Key actions identified by ASI include:
- Designing modular, repairable, and long-lived products in construction, transport, and packaging.
- Improving collection, especially for post-consumer scrap in emerging economies.
- Strengthening data and traceability across value chains to support circularity metrics.
- Supporting the development of skills and inclusive business models that integrate informal workers and waste pickers, particularly in the Global South, into formal recycling systems.
- Improving pre-consumer scrap management by identifying and addressing root causes of material losses.
4. Elevating Material Stewardship
rinciple 4 of the ASI Performance Standard focuses on Material Stewardship, covering circularity, product design, and recovery. The insights from CGR 2025 provide a timely reference for the ongoing revision of the standard, which will be significantly expanding the focus on circularity in V4 of the Performance Standard. ASI Members are encouraged to:
- Join the 2027 revision process to align the standard with updated global circularity frameworks.
- Support the integration of indicators that reflect both system-level and operational performance, such as the Circularity Metric.
- Promote consistency with global circularity targets, such as the 17% global target for 2032 and the aluminium sector’s 44% by 2050.
5. From Data to Decisions
CGR 2025 introduces the Circularity Indicator Dashboard, a set of 11 metrics that track the state of material use across the global economy. These indicators offer a structured approach for diagnosing challenges and identifying levers for change.
For the aluminium sector, this dashboard is not only a tool for reflection, but also a guide for next steps. By aligning business practices with these indicators, and by embedding them into standards and reporting frameworks, the sector can support a shift toward more circular systems.
Global circularity rates remain low, but progress in the aluminium sector demonstrates the potential for change. Continued collaboration, innovation, and standards alignment will be key to advancing circularity outcomes in the years ahead.
RELATED TOPICS:
SHARE THIS ARTICLE